POPCAT Price Continues Uptrend, But Momentum Could Be Fading
POPCAT Price has been hitting new all-time highs, with recent indicators suggesting that the uptrend could persist for a little longer. Buyers remain in control, but there are hints that momentum may be starting to slow down.
Traders should monitor key levels that may trigger more buying interest or spark selling pressure. Depending on how these factors play out, POPCAT could soar to new records or face a sharp pullback.
POPCAT Uptrend Could Continue In The Next DaysPOPCAT +DI currently sits at 22.94, reflecting strong buying momentum, while the -DI is far lower at 10.56, indicating that selling pressure remains weak. This disparity between the two lines shows that buyers are in control, driving the price upward.
The ADX, which measures the strength of the trend, currently stands at 21.49. The Directional Movement Index (DMI) is a key indicator used to evaluate both the direction and strength of a trend.
The +DI tracks bullish pressure, while the -DI tracks bearish pressure, and the ADX confirms how strong or weak the trend is. When the ADX is above 20, as it is now, it signals that the trend is gaining traction, whether it’s an uptrend or a downtrend.
Read more: 11 Top Solana Meme Coins to Watch in October 2024
 POPCAT Directional Movement Index. Source: TradingView
It’s important to note that the ADX has been decreasing, indicating that while the uptrend is still intact, its momentum is weaker than in previous days.
Despite this weakening trend, the ADX remains at a solid level, suggesting that POPCAT’s upward movement will likely continue in the short term before it begins to fade. While buyers still have the advantage, the trend may soon lose momentum.
POPCAT RSI Is Still HealthyPOPCAT’s RSI is currently sitting at 62.32, indicating that there is still room for growth before the asset enters the overbought territory, which suggests more potential upside in terms of price movement.
The Relative Strength Index (RSI) is a widely used momentum oscillator that measures the strength of price changes by evaluating recent gains and losses. Typically, an RSI value above 70 signals that an asset is overbought, implying that it may be overvalued and could be due for a pullback.
On the other hand, an RSI below 30 indicates an oversold condition, suggesting a possible buying opportunity. With POPCAT’s RSI rising from 43 just three days ago to its current level, it suggests that buying pressure has significantly intensified in a short amount of time.
 POPCAT Relative Strength Index. Source: TradingView
This surge in RSI reflects increased optimism and demand, pushing prices higher as more traders accumulate the asset. However, it’s important to note that if POPCAT’s RSI continues to climb and hits the 70 threshold, it could trigger selling pressure as traders may begin to take profits, expecting a possible price correction.
Until that critical level is reached, the current uptrend could very well continue, with POPCAT reaching new all-time highs.
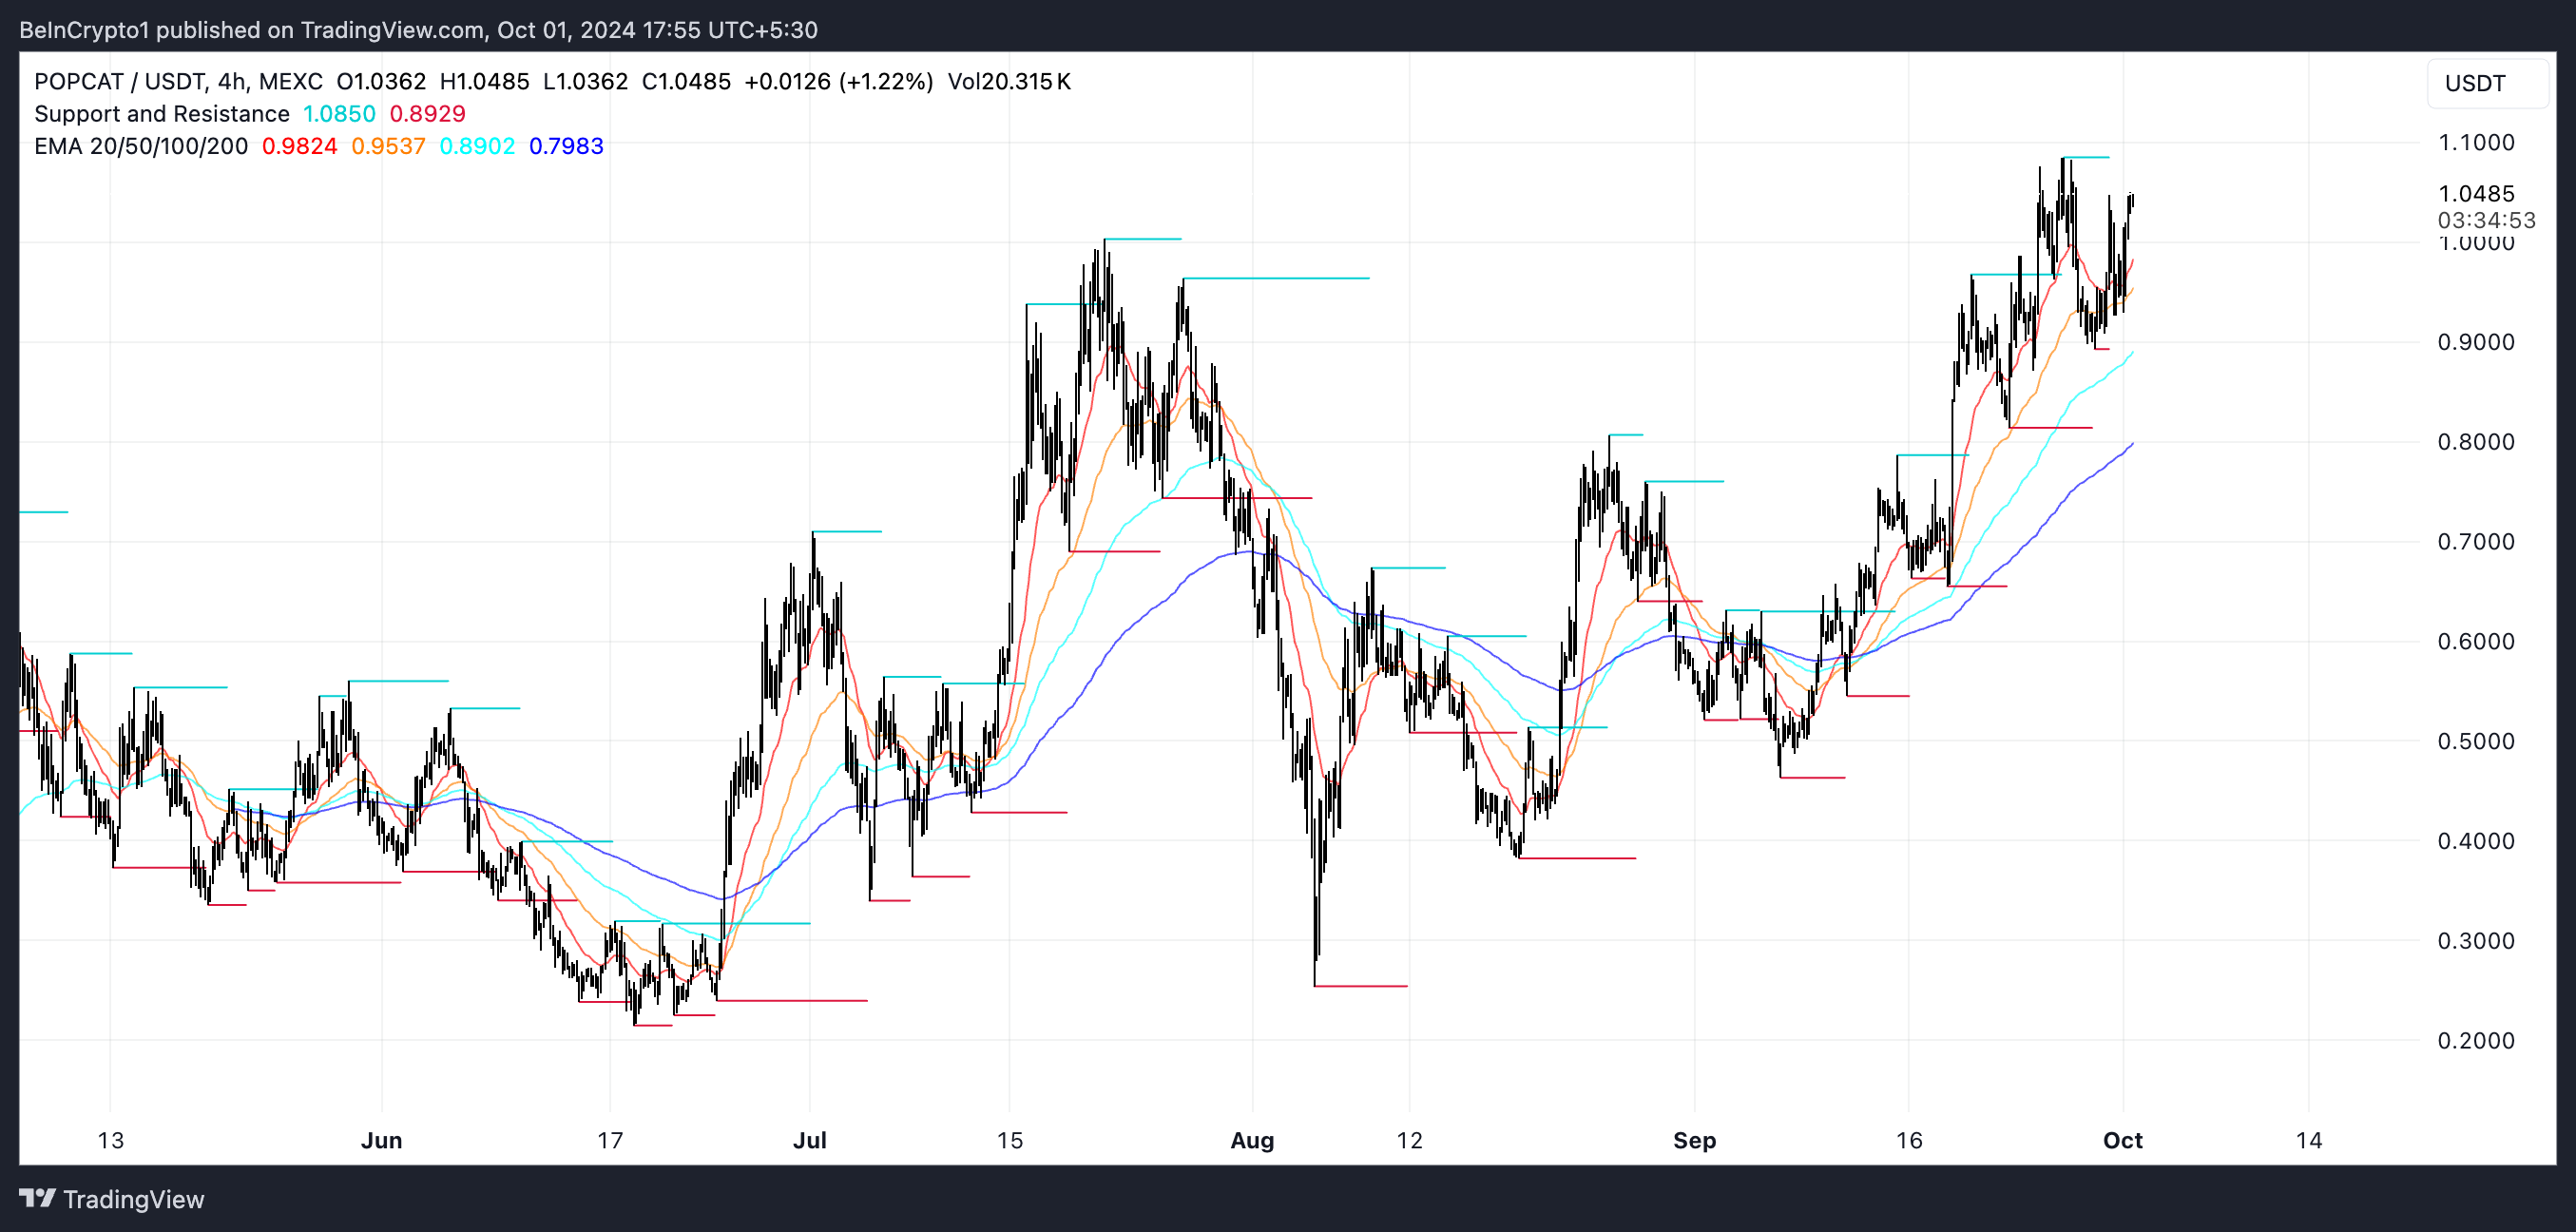
POPCAT Price Prediction: A New All-Time High Or A 29% Drop?POPCAT’s EMA lines are currently bullish, with the short-term moving average positioned above the long-term, signaling that upward momentum is still in play. However, the distance between the lines is not as wide as it was in recent days. That indicates that the strength of the uptrend may be weakening.
Exponential Moving Averages (EMA) are technical indicators that emphasize recent price data. They allow traders to see trends more clearly and react faster to price changes. When the short-term EMA is above the long-term EMA, it suggests that the asset is in a bullish phase. The opposite indicates a bearish phase.
Read more: How to Buy Solana Meme Coins: A Step-By-Step Guide
 POPCAT EMA Lines and Support and Resistance. Source: TradingView.
Despite the slight narrowing of the gap between these lines, if the uptrend continues, POPCAT, as one of the leading meme coins in the Solana ecosystem, could potentially test the resistance level at $1.08. If that one is broken, push toward the $1.10 threshold and above, setting new all-time highs.
However, if the trend reverses in the coming days, the price could drop significantly. Potential retracements could be seen down to $0.81 or even $0.74. That would represent a possible 29% decline from current levels.
The post POPCAT Price Continues Uptrend, But Momentum Could Be Fading appeared first on BeInCrypto.
