XRP Price Loses 9% Gains in 48 Hours: Support Floor Holds Steady
XRP price continues to struggle around the $0.60 mark, hovering near it for the last month and a half.
This lack of growth is gradually resulting in macro bearishness and could flip the conditions completely.
Ripple Native Token ConcedesLike other altcoins, XRP price was a victim of the broader market’s crash over the last two days. The crypto asset fell below the 38.2% Fibonacci Retracement level for the fourth time in the last six weeks.
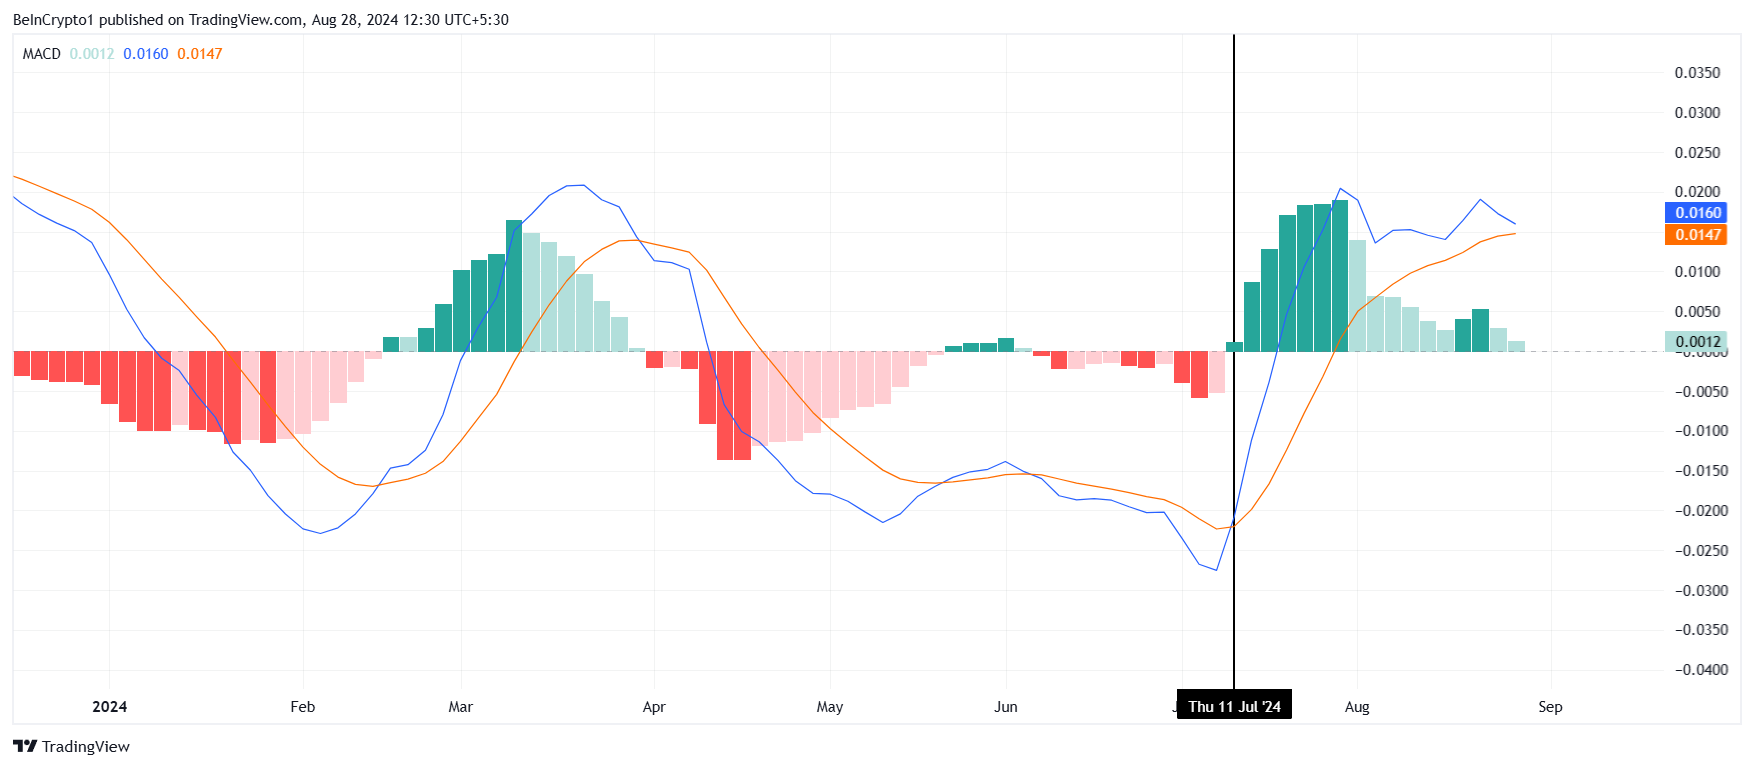
These consistently failing attempts at a rally are feeding the gradually developing macro bearishness, visible on the Moving Average Convergence Divergence (MACD). The MACD indicator is a trend-following momentum tool that shows the relationship between two moving averages of an asset’s price.
The waning bullish momentum suggests that a bearish crossover could be on the horizon. This potential crossover is concerning because it could lead to further price drawdown, marking the first such instance since early July.
Read more: XRP ETF Explained: What It Is and How It Works
 XRP MACD. Source: TradingView
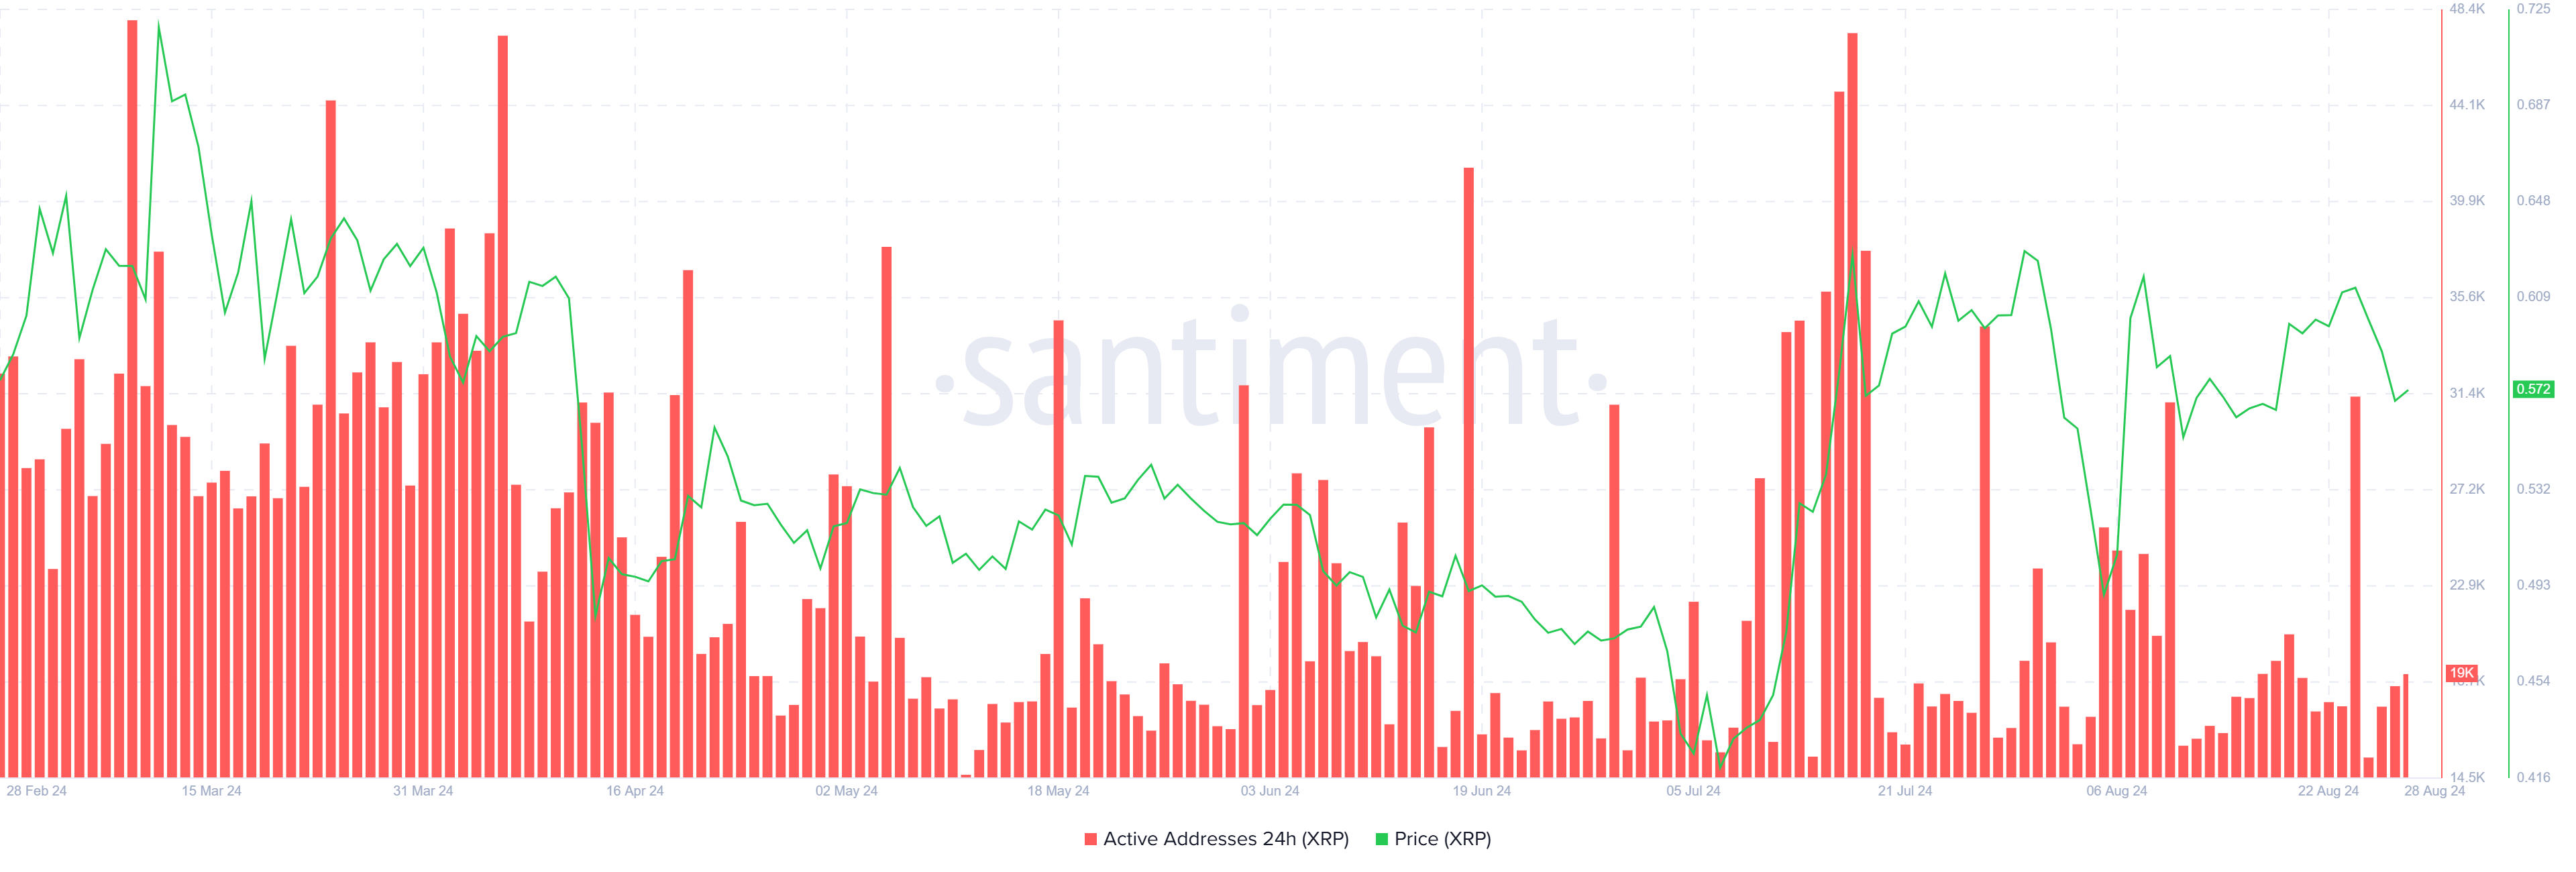
Additionally, participation on the network in the case of XRP has been consistently spiking. However, this uptick in activity has not translated into real growth. Despite higher engagement levels, active addresses have been meager, which raises concerns about the sustainability of the current market trend.
The lack of real growth in market participation is not a positive indicator of XRP’s price movement. Thus, currently, XRP holders’ activity seems to be preventing the price from falling further. This stability suggests that while the market may not be experiencing significant gains, it is also not seeing dramatic declines due to the support from current holders.
 XRP Active Addresses. Source: Santiment
XRP Price Prediction: Just Keep Swinging
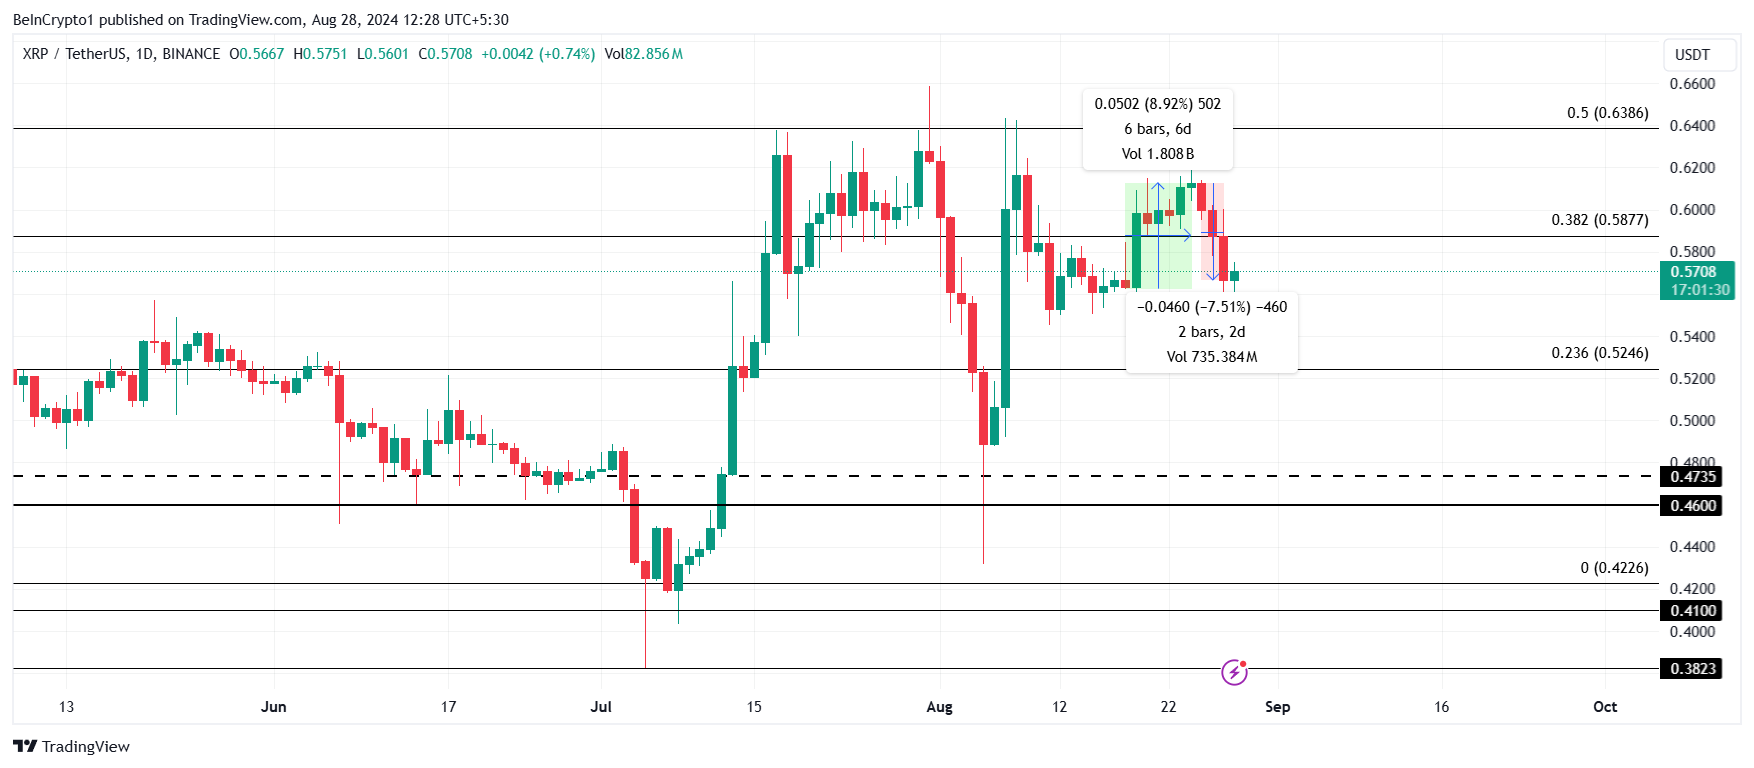
XRP price fell by 7.5% in the last 48 hours, which was enough to wipe out the 9% gains noted recently. In fact, the sudden change in sentiment impacted this drawdown in a third of the time it took XRP to note the gains.
Nevertheless, XRP price fell below the 38.2% Fibonacci Retracement at $0.58 and is currently at $0.57. If the bearish conditions intensify, the likely outcome is a drop to $0.52, where the 23.6% Fib line lies. Also known as the bear market support floor, this level would prevent further decline.
Read more: Ripple (XRP) Price Prediction 2024/2025/2030
 XRP Price Analysis. Source: TradingView
On the other hand, if the altcoin follows the past tradition, it could recover above the 38.2% Fib line. This would enable the crypto asset to rise beyond $0.60, invalidating the bearish thesis.
The post XRP Price Loses 9% Gains in 48 Hours: Support Floor Holds Steady appeared first on BeInCrypto.
