Willy Woo Predicts Bullish Trend: Can Bitcoin Price Break $60K Amid Uncertainty?

The post Willy Woo Predicts Bullish Trend: Can Bitcoin Price Break $60K Amid Uncertainty? appeared first on Coinpedia Fintech News
With the release of bullish US CPI data, the global market conditions surprisingly turn bullish for Bitcoin price and the crypto industry. Recently, the United Kingdom passed a new bill that considers digital assets personal properties.
This bill will create a third category of personal property. However, some fundamental shifts in the traditional market correlating with Bitcoin are turning sour. Let’s examine the underlying challenges to determine if Bitcoin will hit $60,000 this week.
Bitcoin Price PerformanceStarting with the weekly chart, the bullish trend of 2023 and early 2024 maintains a falling channel pattern as a pullback and tests the 50-week EMA. However, in the past week, Bitcoin price has surged by 6.03% to make a bullish engulfing candle.
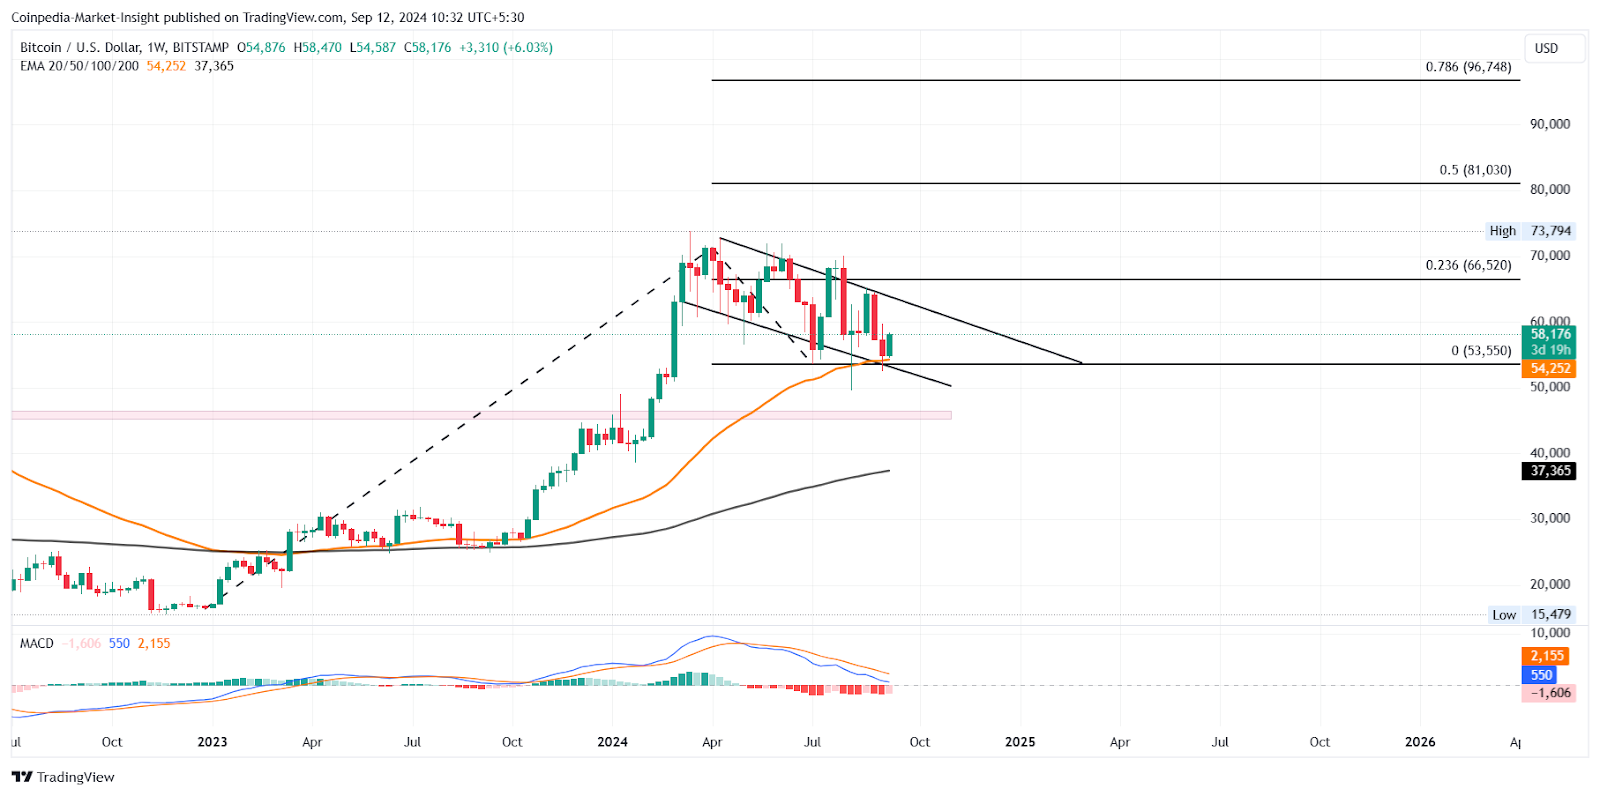
At the base of the support trend line and the 50-week EMA, this signals a potential bull cycle ahead. In the weekly chart, a closer inspection of the weekly return puts Bitcoin on a stronger foot.
The Bitcoin price has increased by 7.79% in the last six days with most bullish candles and a long tail pin bar candle. Currently, the 23.60% Fibonacci level in the daily chart is challenging at $58,655.
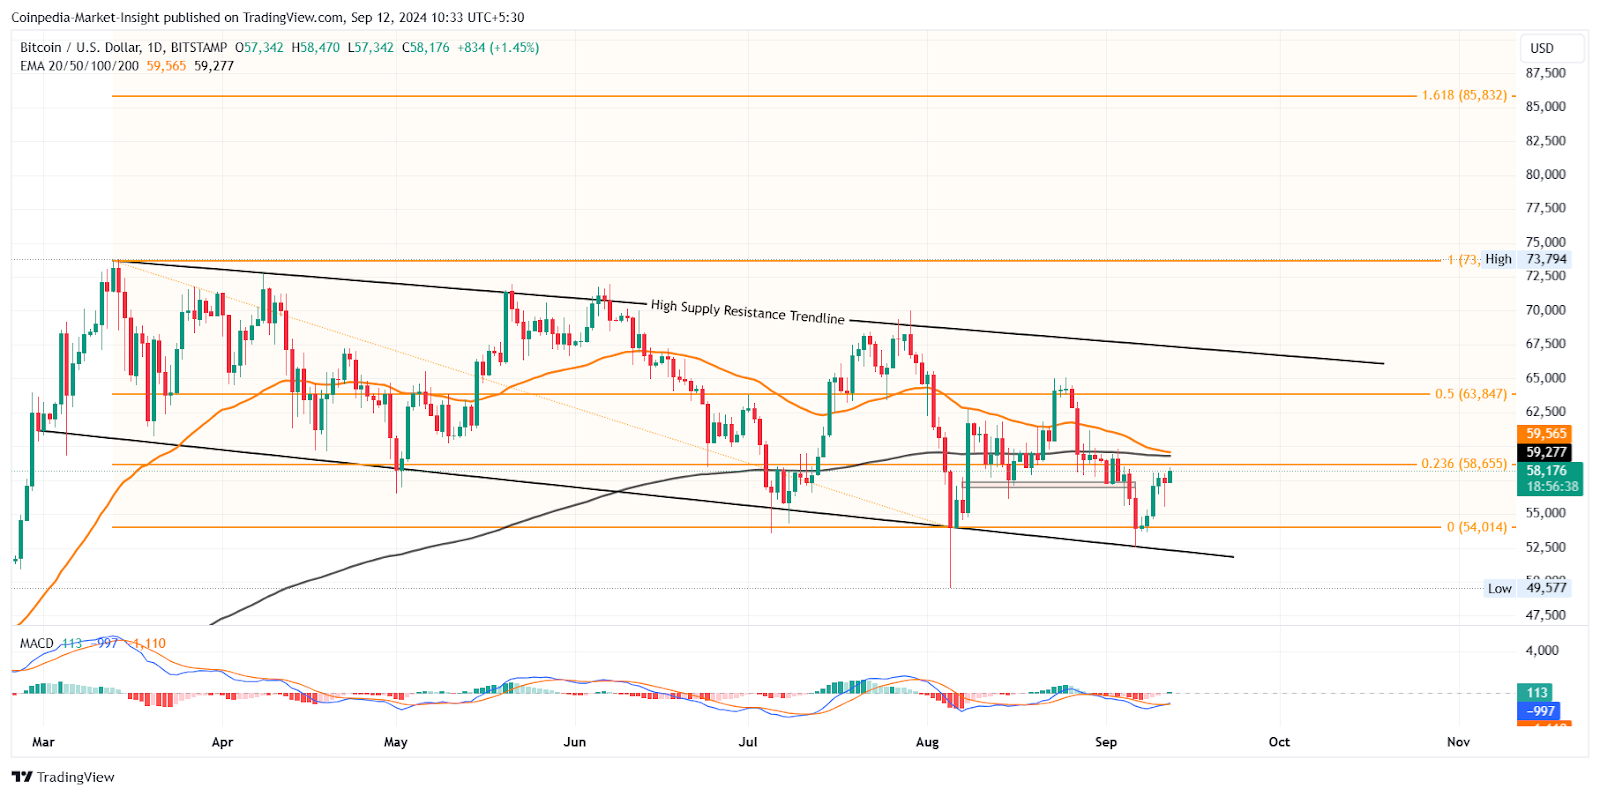
Furthermore, the double bottom pattern in the daily chart is gaining momentum as it takes low price rejection from the support trend line. However, the possibility of death cross looms over the daily chart.
On a closer inspection of the 4-hour frame, the bullish reversal has surpassed the 50-week EMA and a local resistance trend line. The bull run in Bitcoin price now faces opposition from the 200 EMA in the 4-hour chart and the 38.20% Fib level at $58,314.
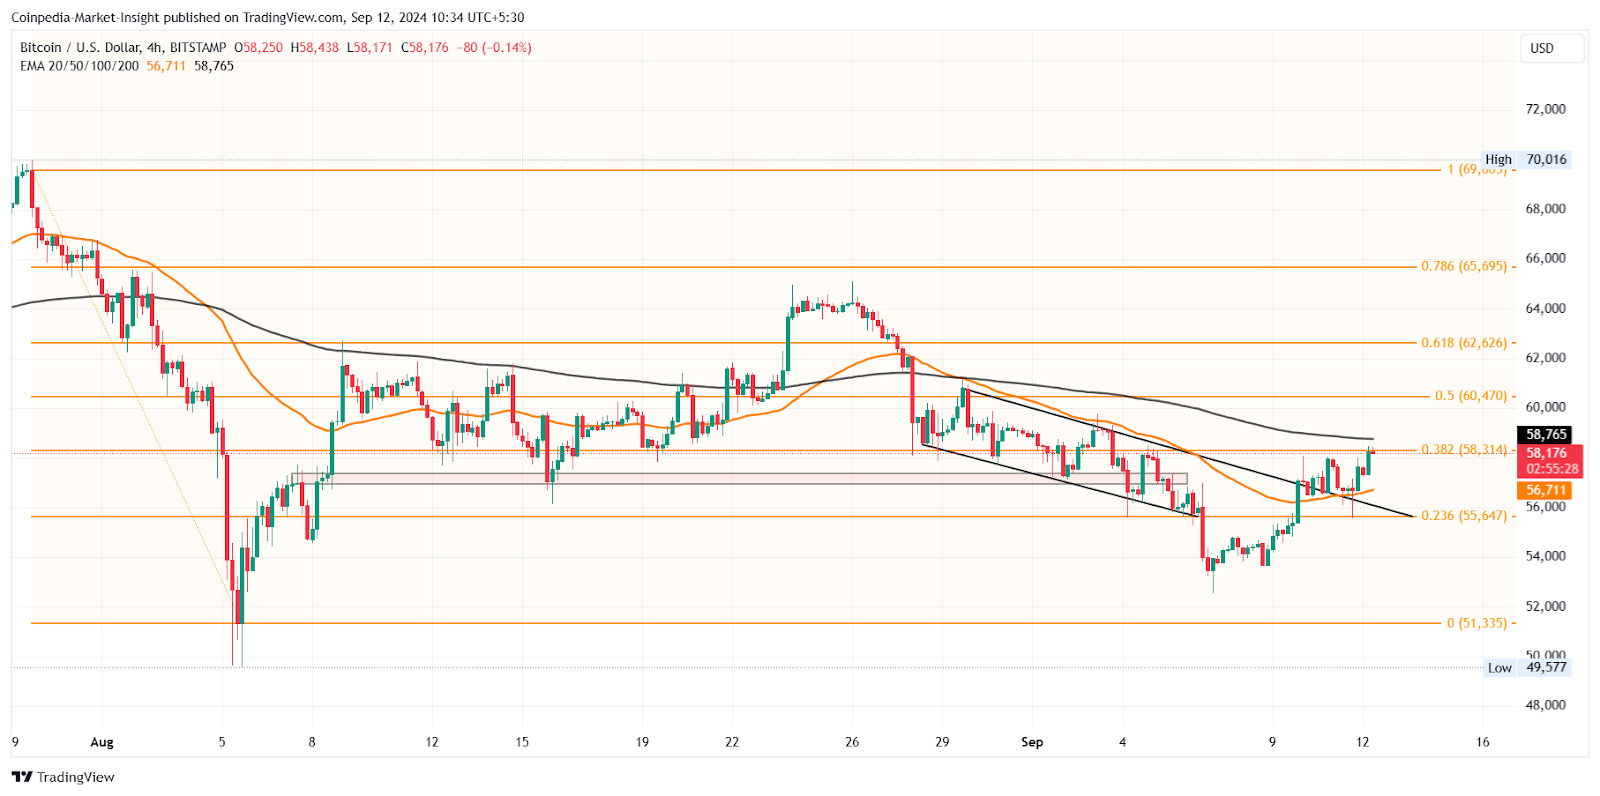
Nevertheless, the bullish uptick in the 50-week EMA of the 4-hour chart projects a possibility of a longer-term uptrend with a potential golden crossover.
Willy WOO’s Prediction Finds Traditional Finance at RiskAmid the changing dynamics of the price chart, Willy Woo’s recent tweet offers a fresh perspective on Bitcoin’s long-term and medium-term price outlook. In the short term, Willy Woo expects a bullish continuation for the next 1-3 weeks.
However, Willy Woo remains uncertain in the medium term as the trend reversal may take longer to create a new all-time high. Meanwhile, a macro level or a long-term perspective reveals some underlying weaknesses that don’t necessarily put Bitcoin at a bear market risk.
#Bitcoin specific signals:
SHORT TERM: timing signal -> 1-3 wks of bullish swing
MEDIUM TERM: demand/supply bearish since the Apr halving, but some hopium a reversal pattern may have started in the last 4 weeks (still unconfirmed) -> will take more time before ATHs can break…
However, it might come as a re-accumulation phase where investors continue to gather more Bitcoin at lower prices before the next bull move. The risk in traditional finance, with the bond rates falling, puts a risk to all asset classes.
In the past, it has led to major market crashes like the 2020 Covid crash and the 2008 financial crash. Hence, it remains a crucial indicator of predicting such black swan events as these crashes. Further, such crashes eventually led to a long period of growth fuelled by central banks pumping money into the economy.
Hence, in the short term, Bitcoin’s price is likely to continue to exhibit a bullish trend, with uncertainty in the medium term. However, in the long term, it’s likely to face a waiting period before another bullish trend. Meanwhile, the traditional finance markets could face a rocky road before quantitative easing helps the market.
The Polarized On-chain SignalsAs per the recent data from CryptoQuant, the Bitcoin exchange reserves are on a declining trend. As the BTC price hovers near the $58,000 mark, the Bitcoin exchange reserves have dropped down to $2.5 million.
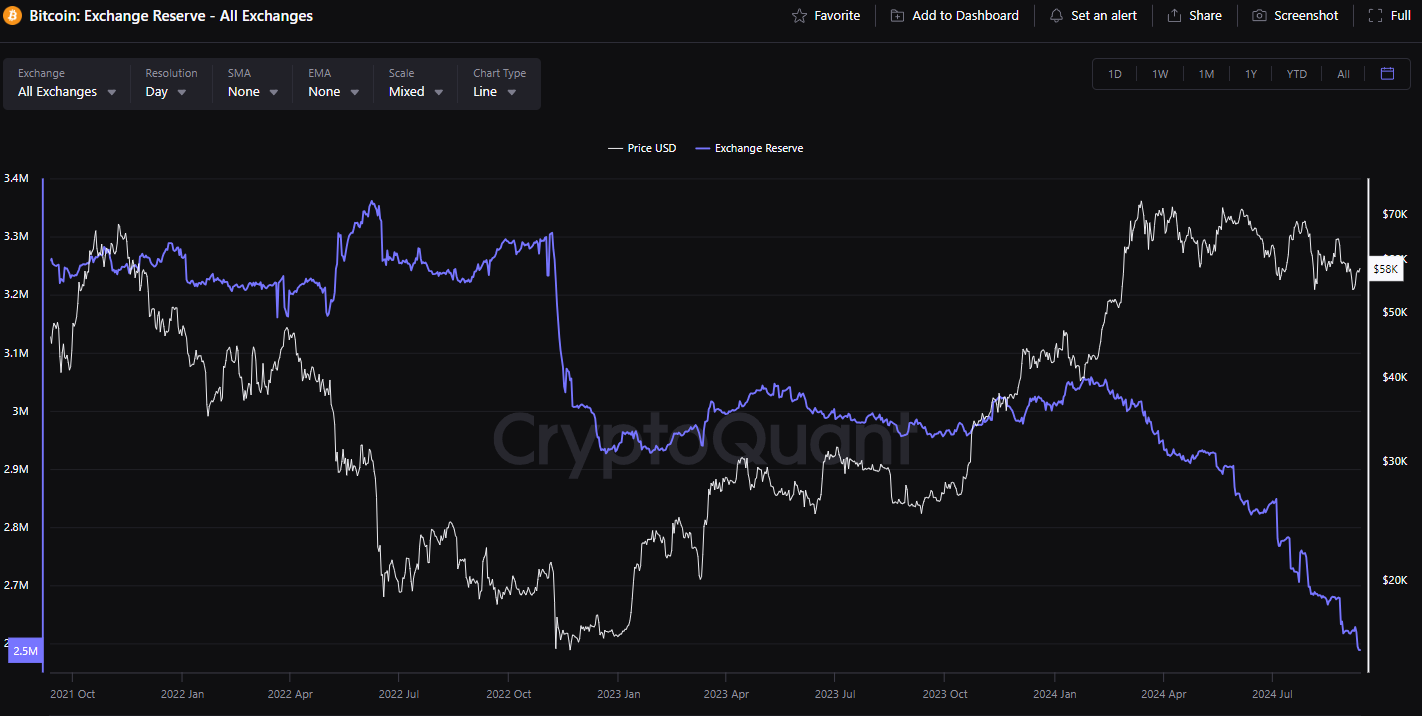
As the exchange reserves are declining, the anticipations of a demand surge leading to a boost in Bitcoin market price are increasing.
However, the correlation between Bitcoin price and gold is signaling a potential risk at hand. In a negative correlation with gold, the rising risk environment signals a potential shift in investors towards traditional safe-haven assets.
Bitcoin remains in a bear phase and it has decoupled from Gold as investors switch to risk-off mode.@cryptoquant_com
Our latest crypto report: https://t.co/XPaaGrs1Wz
A recent analysis by CryptoQuant’s head of research, CQ Julio, reveals the bull-to-bear market cycle indicator positions Bitcoin in a bear phase. Similar to the 2020 crash and the 2021 crash.
Will Bitcoin Price Hit $60K?As the short-term remains positive for Bitcoin, the uptrend is likely to gain dominance over the $60K mark this week. Further, next week’s FOMC meeting and high anticipations of a rate cut will fuel the rally.
Hence, the 50% and 61.80% Fibonacci levels in the 4H chart at $60,470 and $62,626, respectively, are potential target zones.
If you are looking for a detailed analysis of the road ahead for Bitcoin, check out Coinpedia’s Bitcoin price prediction for 2024 and the years ahead.