Why Is The Crypto Market Up Today?
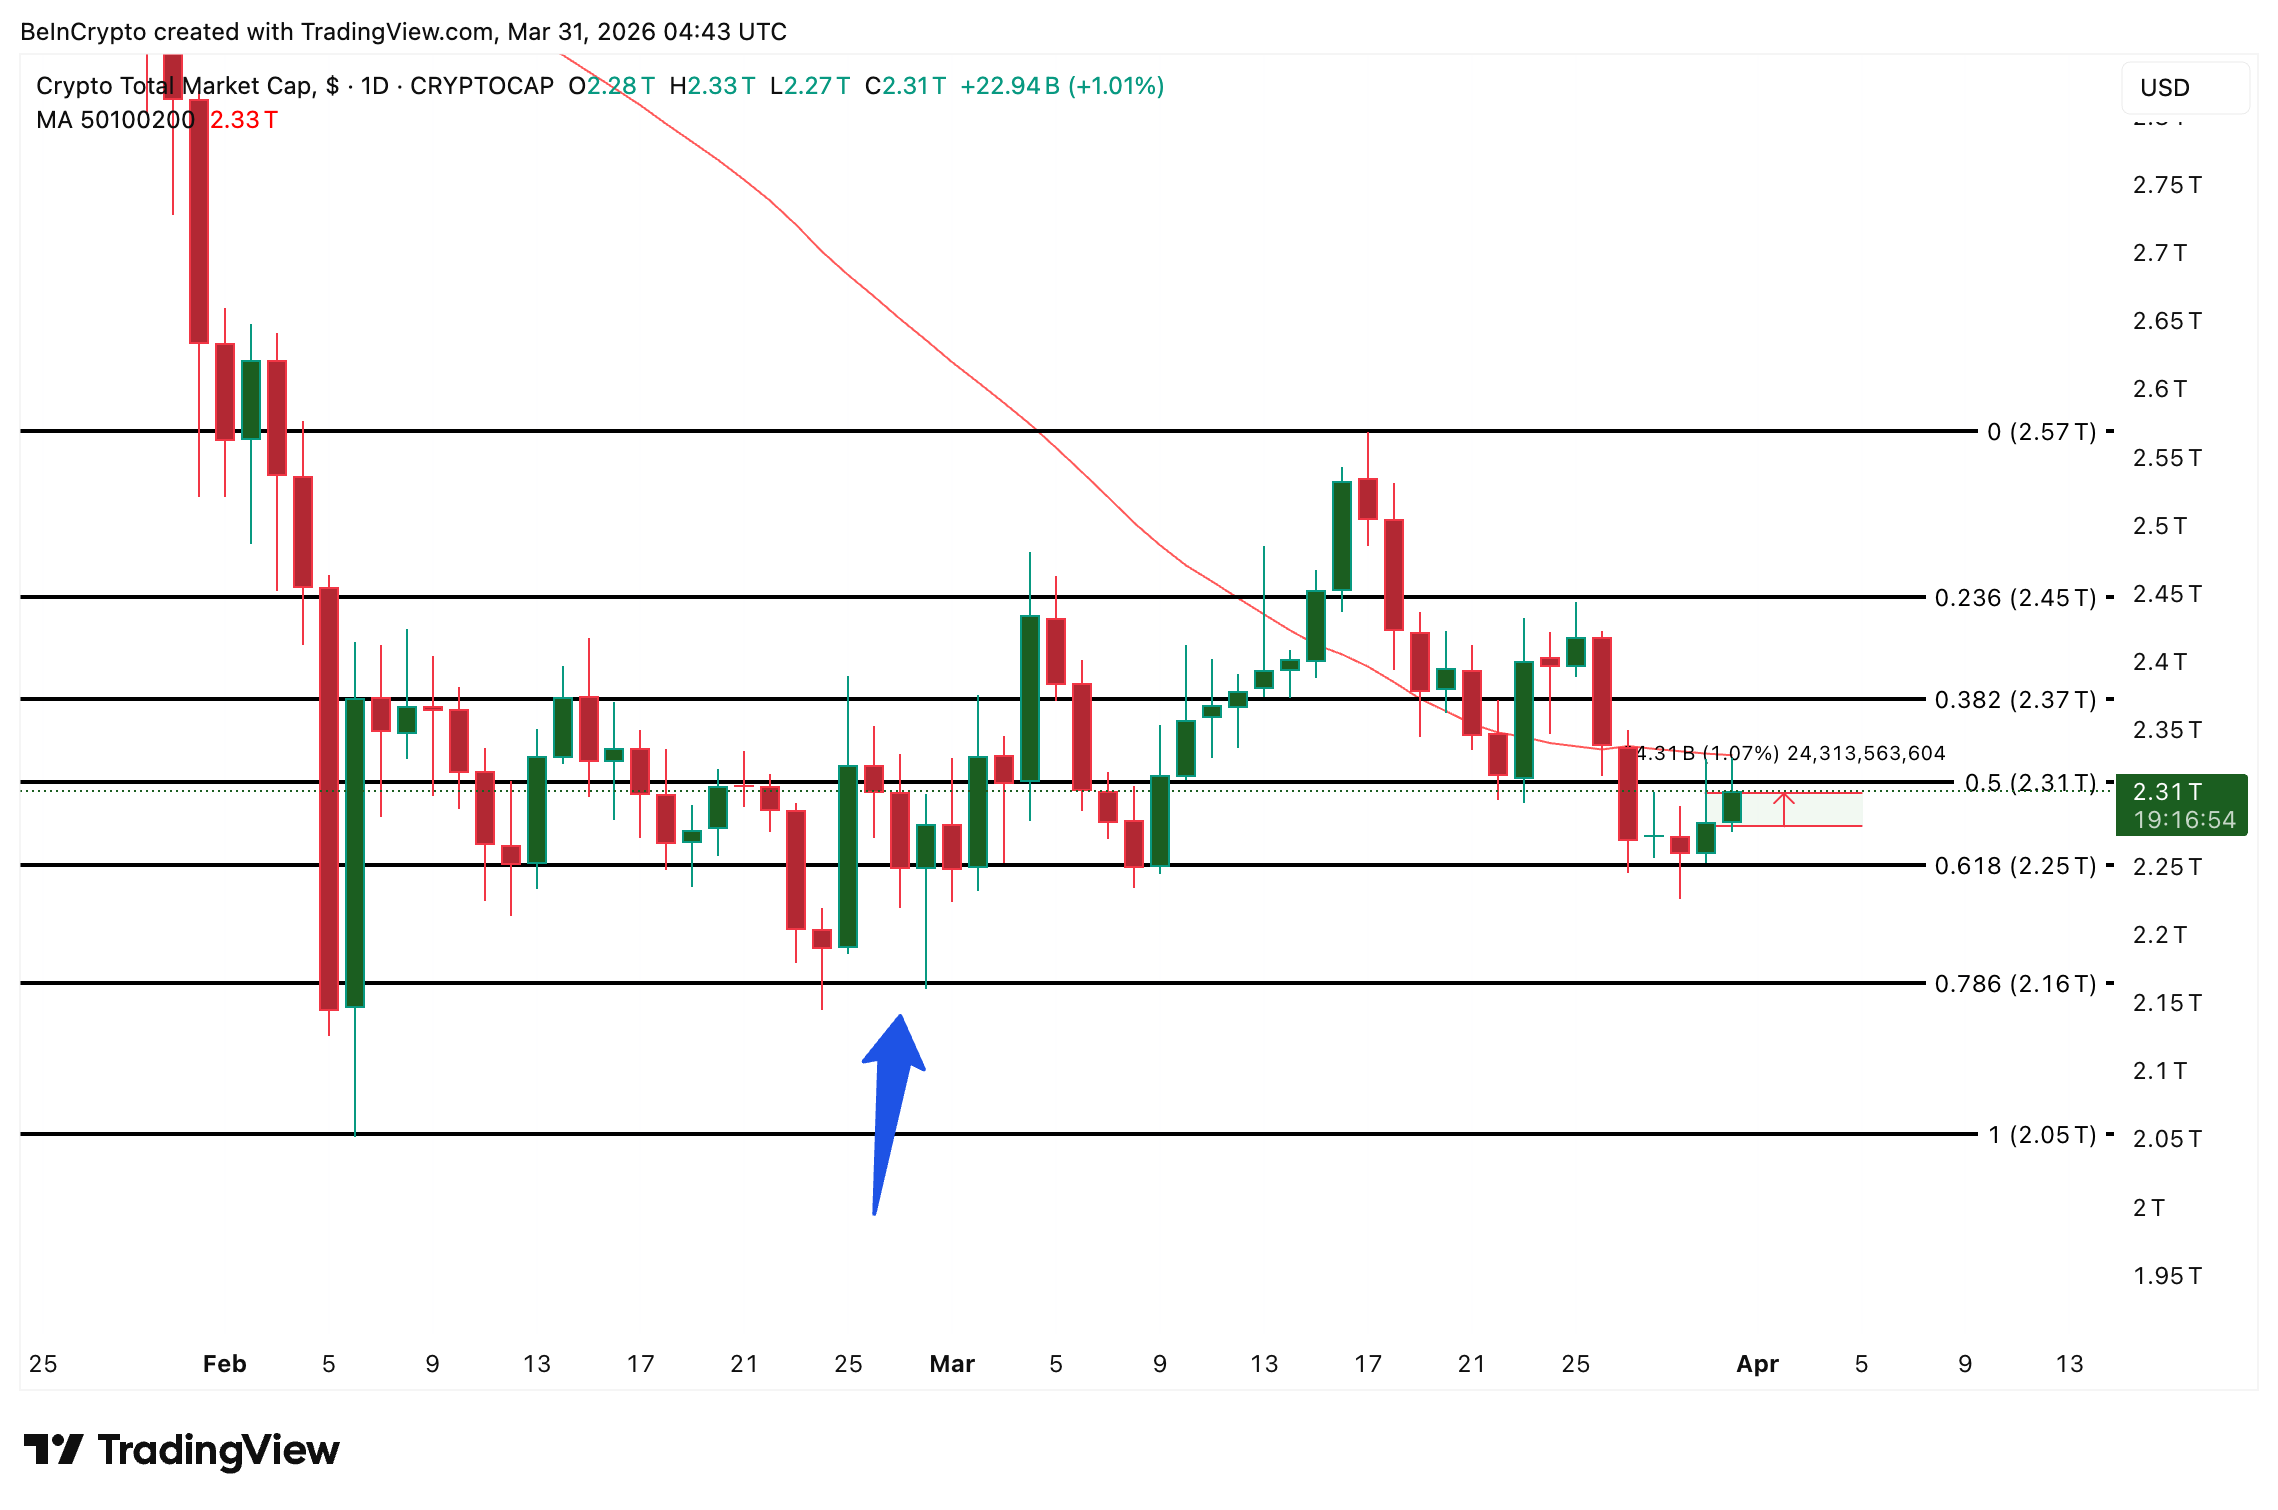
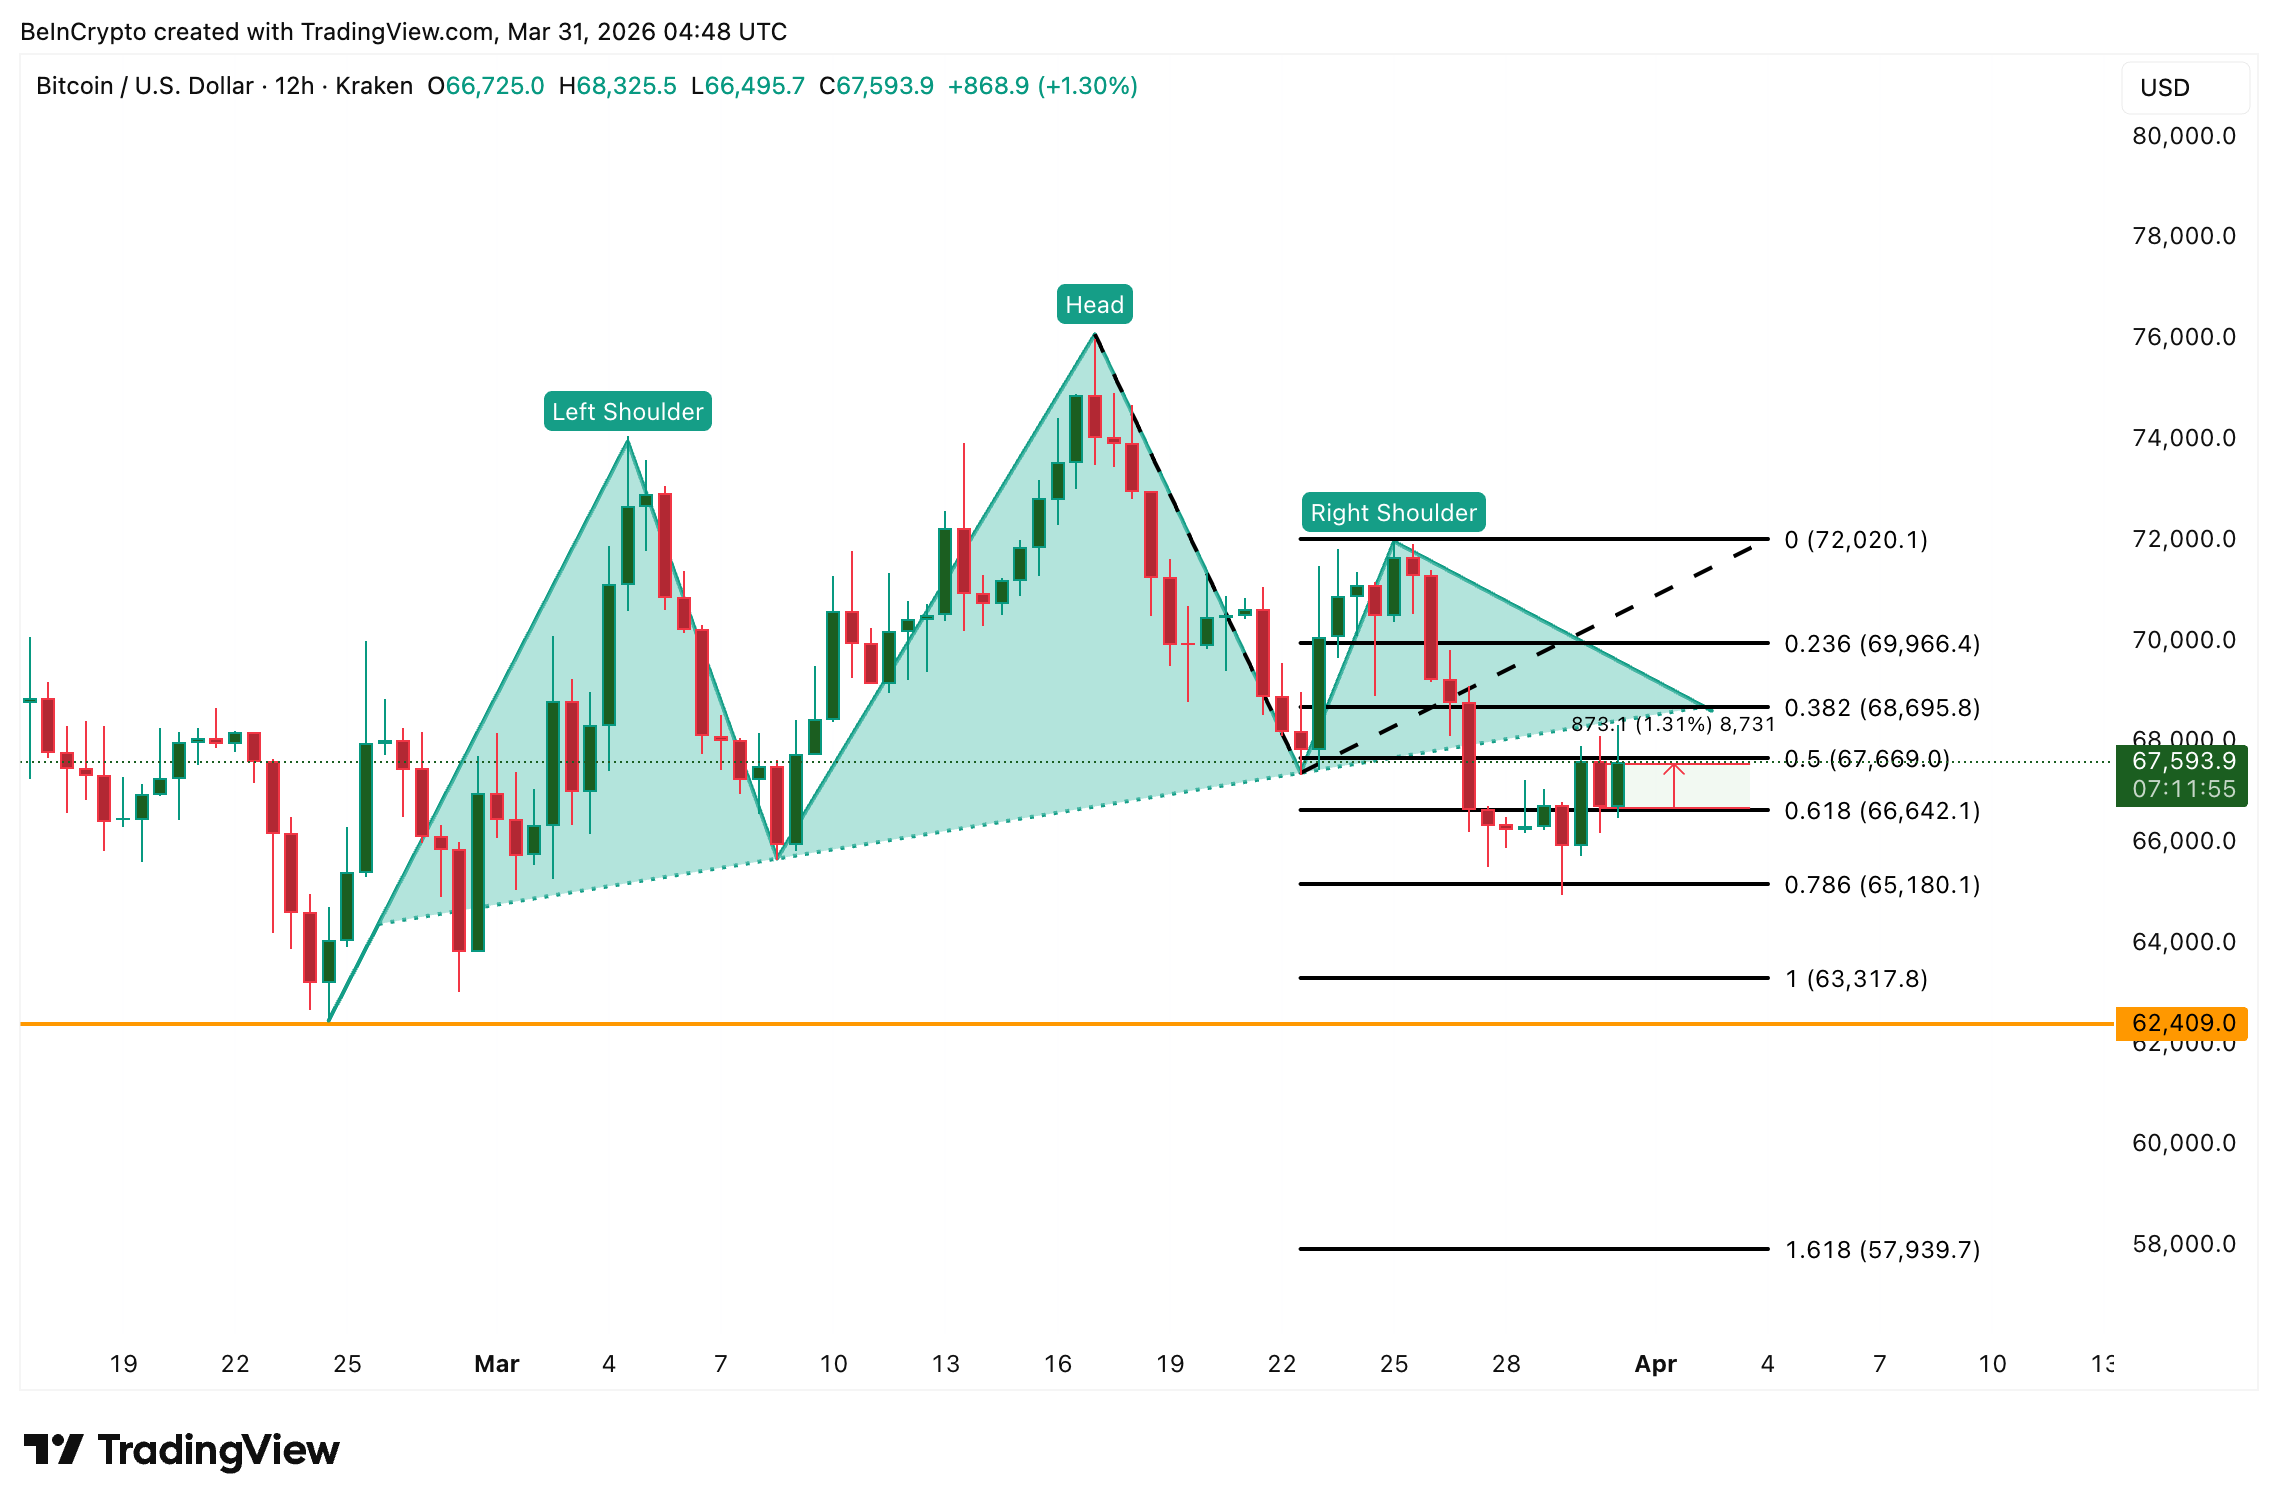
The crypto market looks flat on the surface, but it added $4.31 billion overnight. The move pushed the total market cap to $2.31 trillion as digital assets held steady while US equities stumbled ahead of the quarter’s close. Bitcoin rose 1.31% , defending against the ongoing breakdown that activated on March 27.
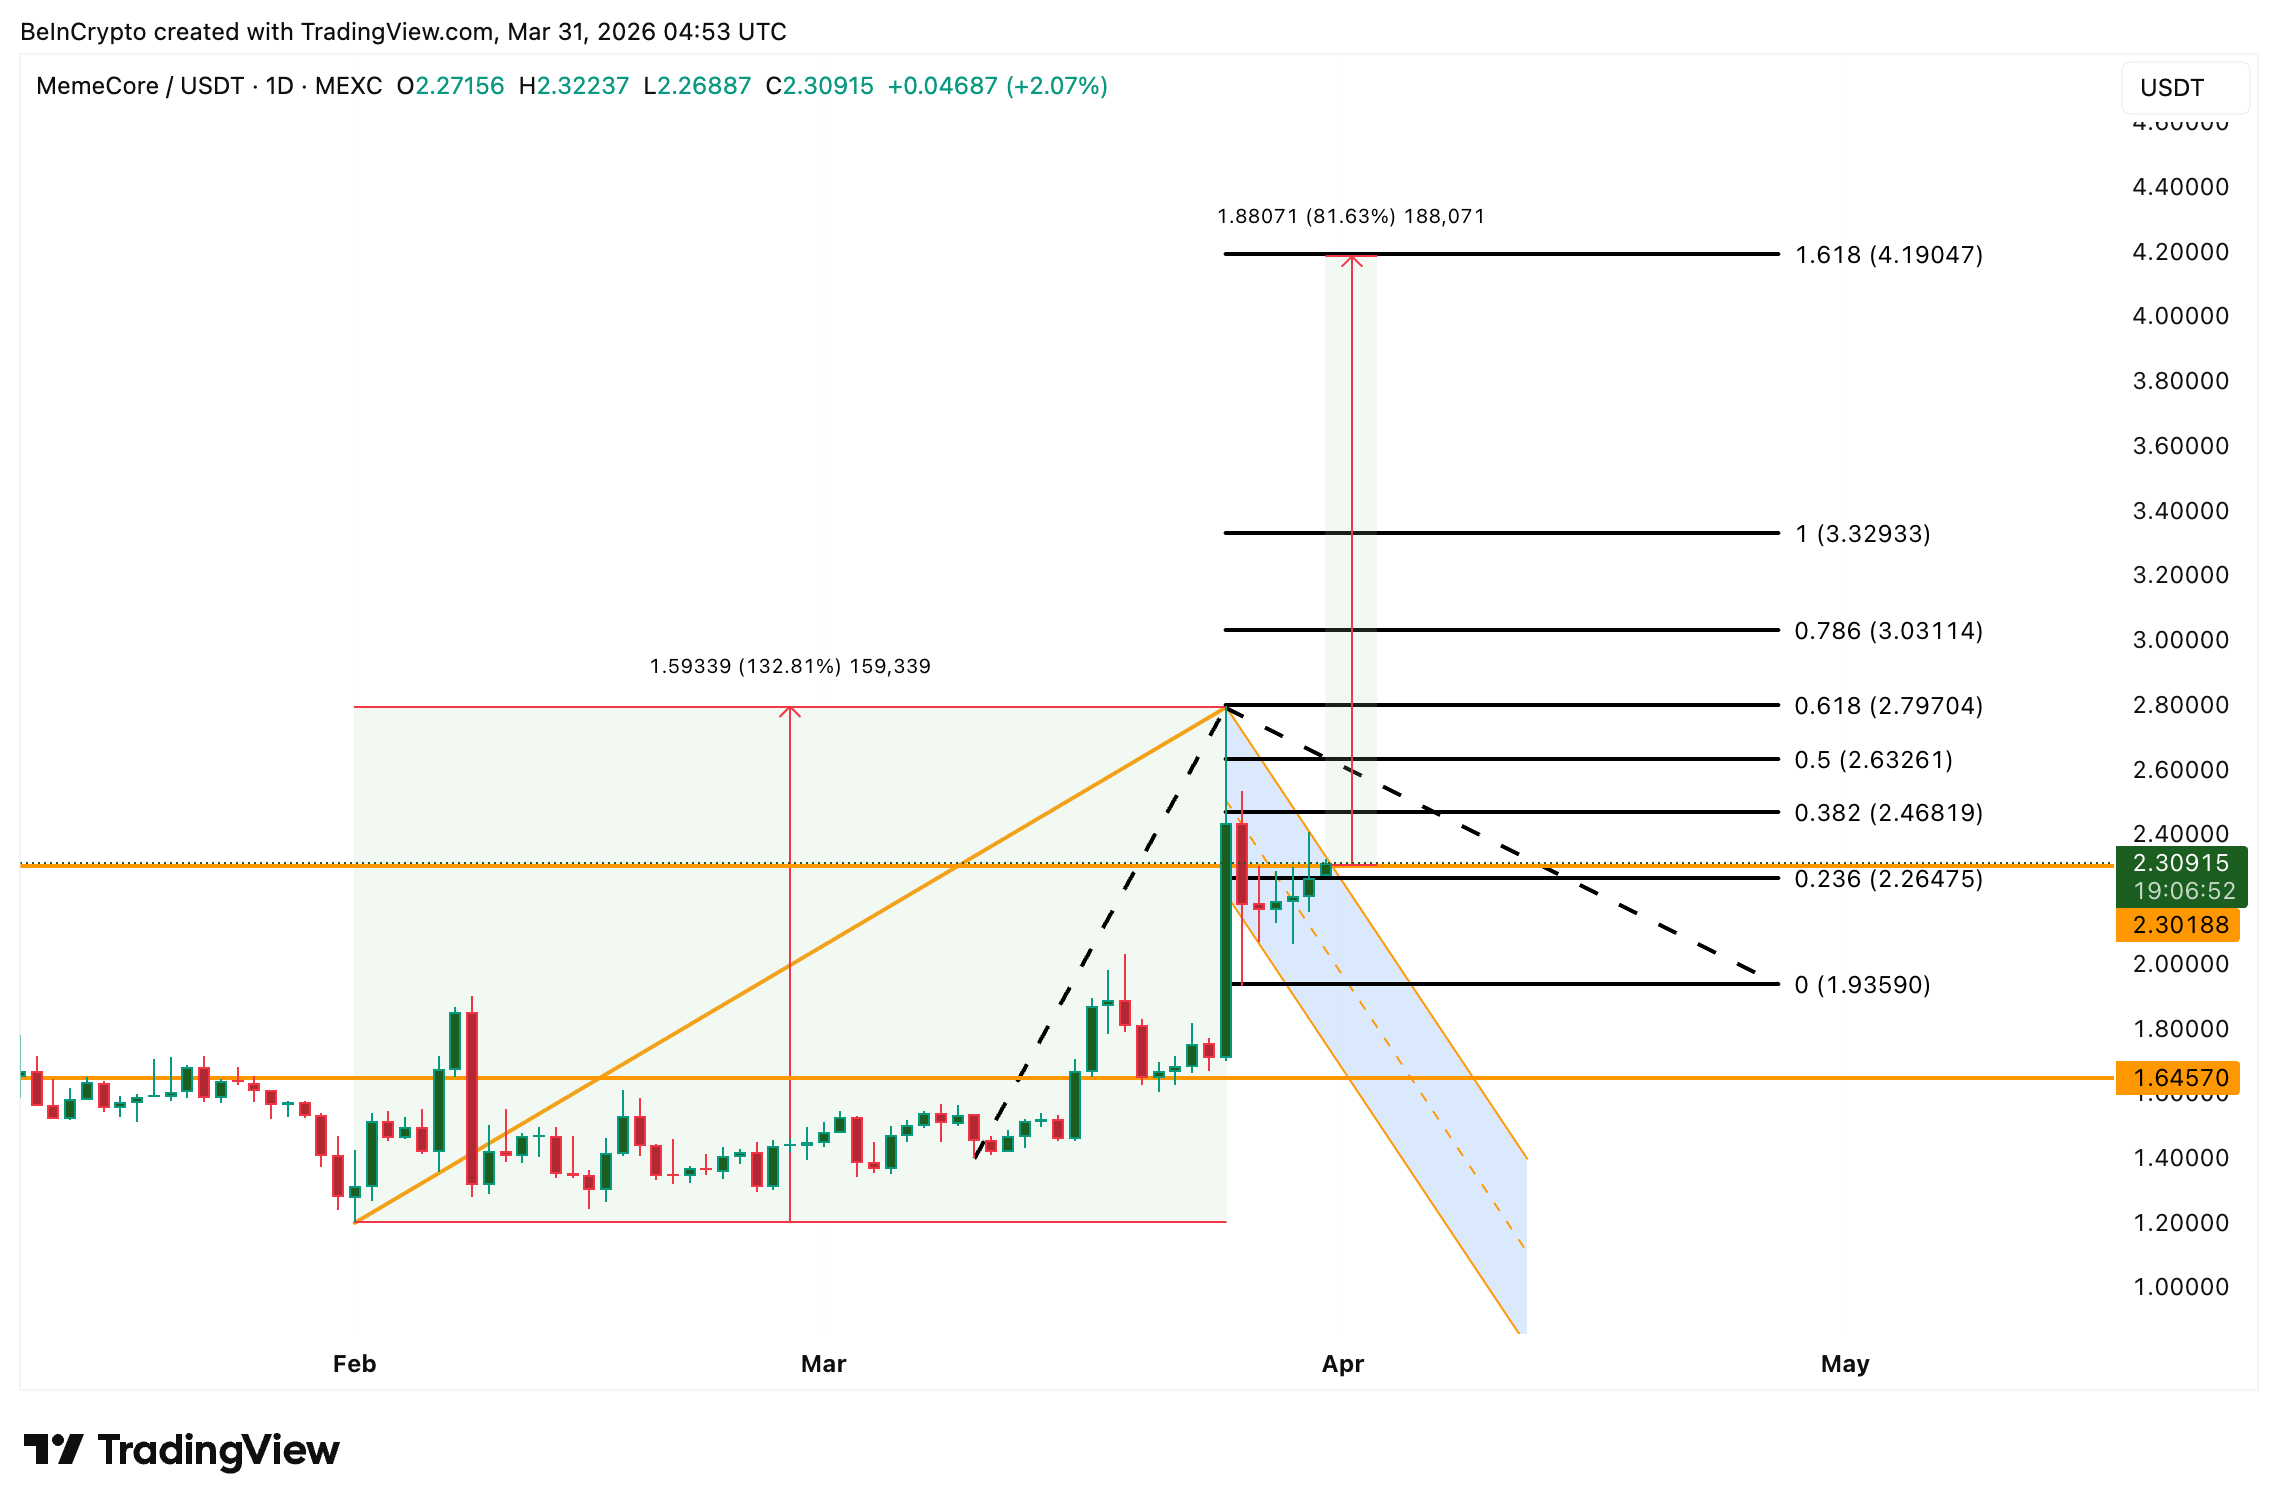
Meanwhile, MemeCore (M), a Layer 1 meme ecosystem token ranked inside the top 100 by market cap, climbed over 3% and carried a 56% gain over the past 30 days.
In the news today:-- The US Department of Labor proposed a rule to ease 401(k) plan access to alternative assets, including cryptocurrencies, private equity, and real estate. This follows President Trump’s August 2025 executive order aimed at expanding retirement investment options for millions of Americans.
- The Senate is preparing an April committee markup of the Digital Asset Market CLARITY Act, with the latest compromise banning passive stablecoin yield while strengthening protections for DeFi developers and non-custodial protocols.
- BitMine Immersion added 71,179 ETH over the past week, bringing total holdings to 4.73 million ETH (3.92% of circulating supply). The company boasts total crypto and cash holdings of $10.7 billion and approximately $177 million in annualized staking revenue, as institutional treasury demand for Ethereum continued even while ETH prices remained under pressure.
The total crypto market cap traded at $2.31 trillion on March 31, up 1% from yesterday’s close at press time. This happened as digital assets broke from the risk-off pattern that dragged equities lower. The S&P 500 closed 0.39% lower, while the VIX remained above 30, levels typically associated with elevated fear.
That divergence gave crypto its strongest relative-performance signal in weeks. The proposed 401(k) access rule and momentum behind the CLARITY Act provide a regulatory floor beneath sentiment that pure price action alone could not explain.
TOTAL is now testing the 50-day moving average at $2.33 trillion. This level has acted as resistance through late March. A daily close above that threshold could open the path toward $2.37 trillion and then $2.45 trillion.
Want more token insights like this? Sign up for Editor Harsh Notariya’s Daily Crypto Newsletter here.
 TOTAL Crypto Market Cap Analysis: TradingView
However, $2.25 trillion has served as a firm support floor since late February. The market’s ability to hold above it depends largely on whether Bitcoin can continue defending its own critical support. A daily close below $2.25 trillion would expose $2.16 trillion and $2.05 trillion.
Bitcoin’s Defense Anchors the Broader Crypto RecoveryBitcoin traded above $67,500, up 1.31% from yesterday’s close. It is this defense of the 0.618 Fibonacci level at $66,640 that is doing the most work in keeping the total market cap above its $2.25 trillion floor.
The head-and-shoulders pattern that broke down on March 27, put $63,310 as a target, with $65,180 as an intermediate level.
The fact that BTC absorbed the equity sell pressure without breaching $66,640 suggests that the same regulatory tailwinds propping up broader sentiment are giving holders a reason to defend this zone rather than capitulate.
On the upside, a reclaim of $68,690 (the 0.382 Fibonacci) would be the first signal that bulls are absorbing the pattern’s sell pressure and could pull TOTAL above its 50-day moving average in tandem.
 Bitcoin Price Analysis: TradingView
A push above $72,020 would weaken the bearish structure. A daily close above $68,690 targets $69,960. A close below $66,640 exposes $65,180 and $63,310, which would likely drag the total market cap below $2.25 trillion with it.
MemeCore (M) Bull Flag Builds on the Floor Bitcoin Is HoldingMemeCore traded at $2.30, up 3% on the day and 56% over the past 30 days. This makes it one of the strongest performers inside the top 100 during a period when most tokens traded flat or lower.
The Layer 1 blockchain, which serves as infrastructure for the meme coin economy rather than being a meme coin itself, has benefited directly from the broader-market stability that Bitcoin’s $66,640 defense is providing. Without that floor, risk-on assets like M would face significantly more selling pressure.
The daily chart shows a bull flag formation. The pole stretched approximately 132% from early February lows, and the current consolidation is forming a flag between $1.93 and $2.30.
 MemeCore Price Analysis: TradingView
A daily close above the upper trendline at $2.30 would confirm the pattern. It would then put the 0.382 Fibonacci level at $2.46 as the first target. Yet, the $2.79 level (0.618 Fib) determines whether the rally has legs to move higher or not. If momentum persists through the meme sector, the 1.618 extension at $4.19 sits as the outer target.
A drop below $1.93 weakens the bull flag. And a break under $1.64 separates a continuation rally from a return to Q1 lows by invalidating the pattern.
The post Why Is The Crypto Market Up Today? appeared first on BeInCrypto.