These Analysts Believe Polygon (MATIC) Will Soon Find its Footing – This is Why
The Polygon (MATIC) price trades above a long-term horizontal support area. The area has acted as both support and resistance for nearly three years.
MATIC broke out from a short-term descending resistance trend line but failed to initiate a noteworthy upward movement.
Polygon Trades Above SupportThe technical analysis of the weekly time frame shows that the MATIC price has traded above a long-term horizontal support area for over 90 days. The area has intermittently acted as both support and resistance since April 2021.
While MATIC fell below the area two weeks ago, it created a long lower wick (green icon) and reclaimed it afterward. Despite the bounce, MATIC did not initiate a significant upward movement. Rather, it trades inside the horizontal support area.
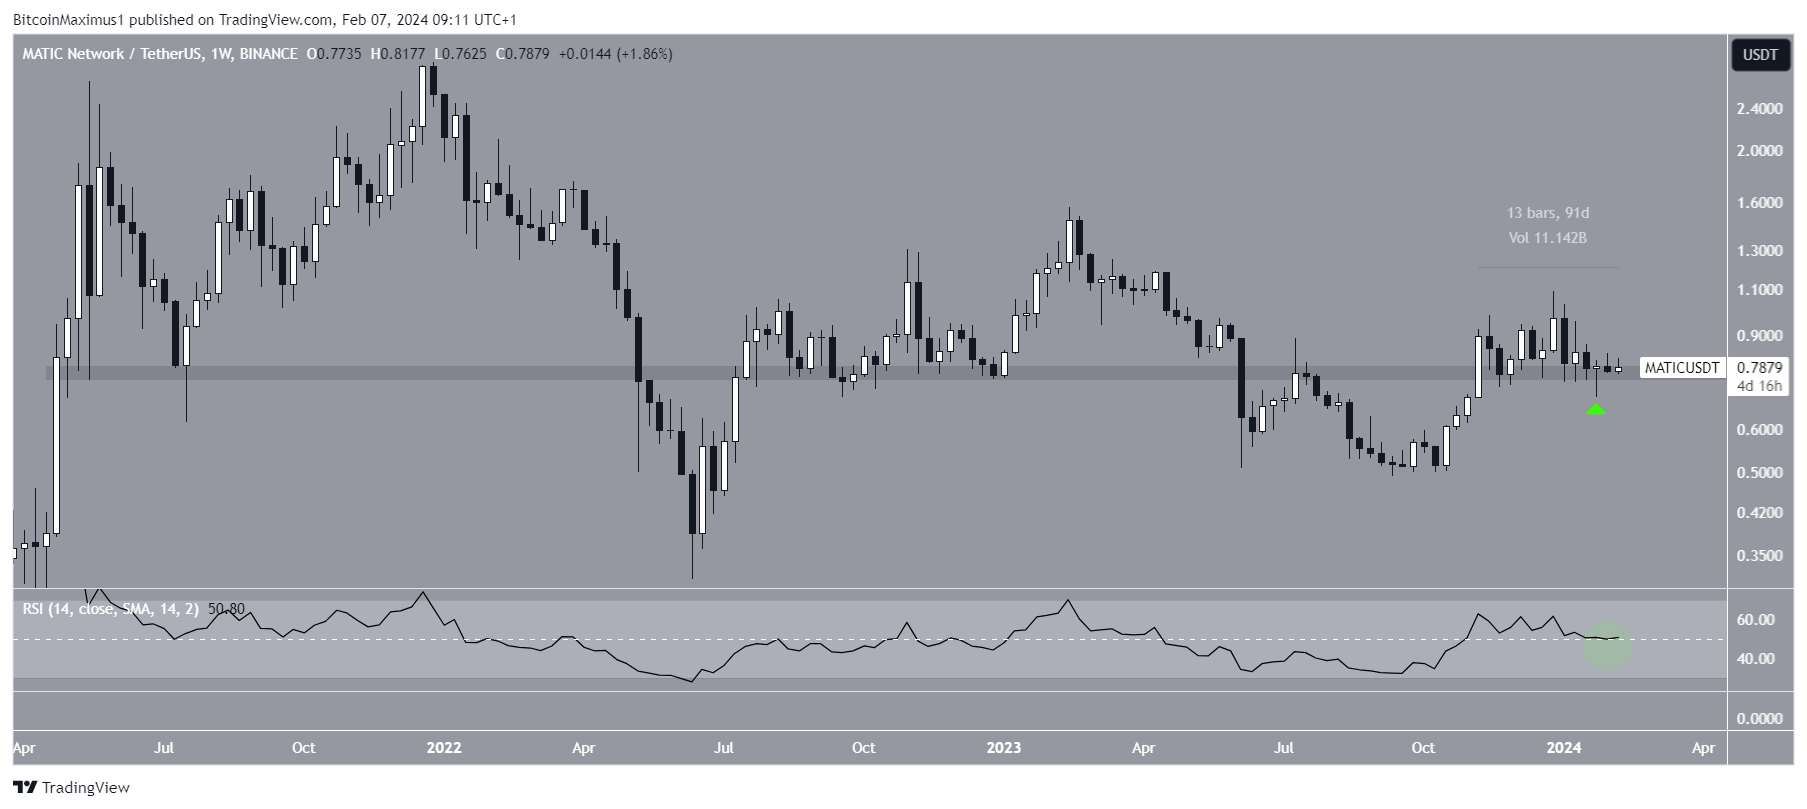 MATIC/USDT Weekly Chart. Source: TradingView
The weekly Relative Strength Index (RSI) is leaning bullish. The RSI is a momentum indicator traders use to evaluate whether a market is overbought or oversold and whether to accumulate or sell an asset.
Readings above 50 and an upward trend suggest that bulls still have an advantage, while readings below 50 indicate the opposite. The indicator seemingly bounced at 50 (green circle) while the price bounced at the horizontal support area, legitimizing the increase.
Read More: How To Buy Polygon (MATIC) and Everything You Need To Know
What Are Analysts Saying?Cryptocurrency traders and analysts on X positively view the future MATIC trend.
ColdBloodShill believes that MATIC has one of the best-looking higher time frame charts because of its reclaim of support and sweep below the lows.
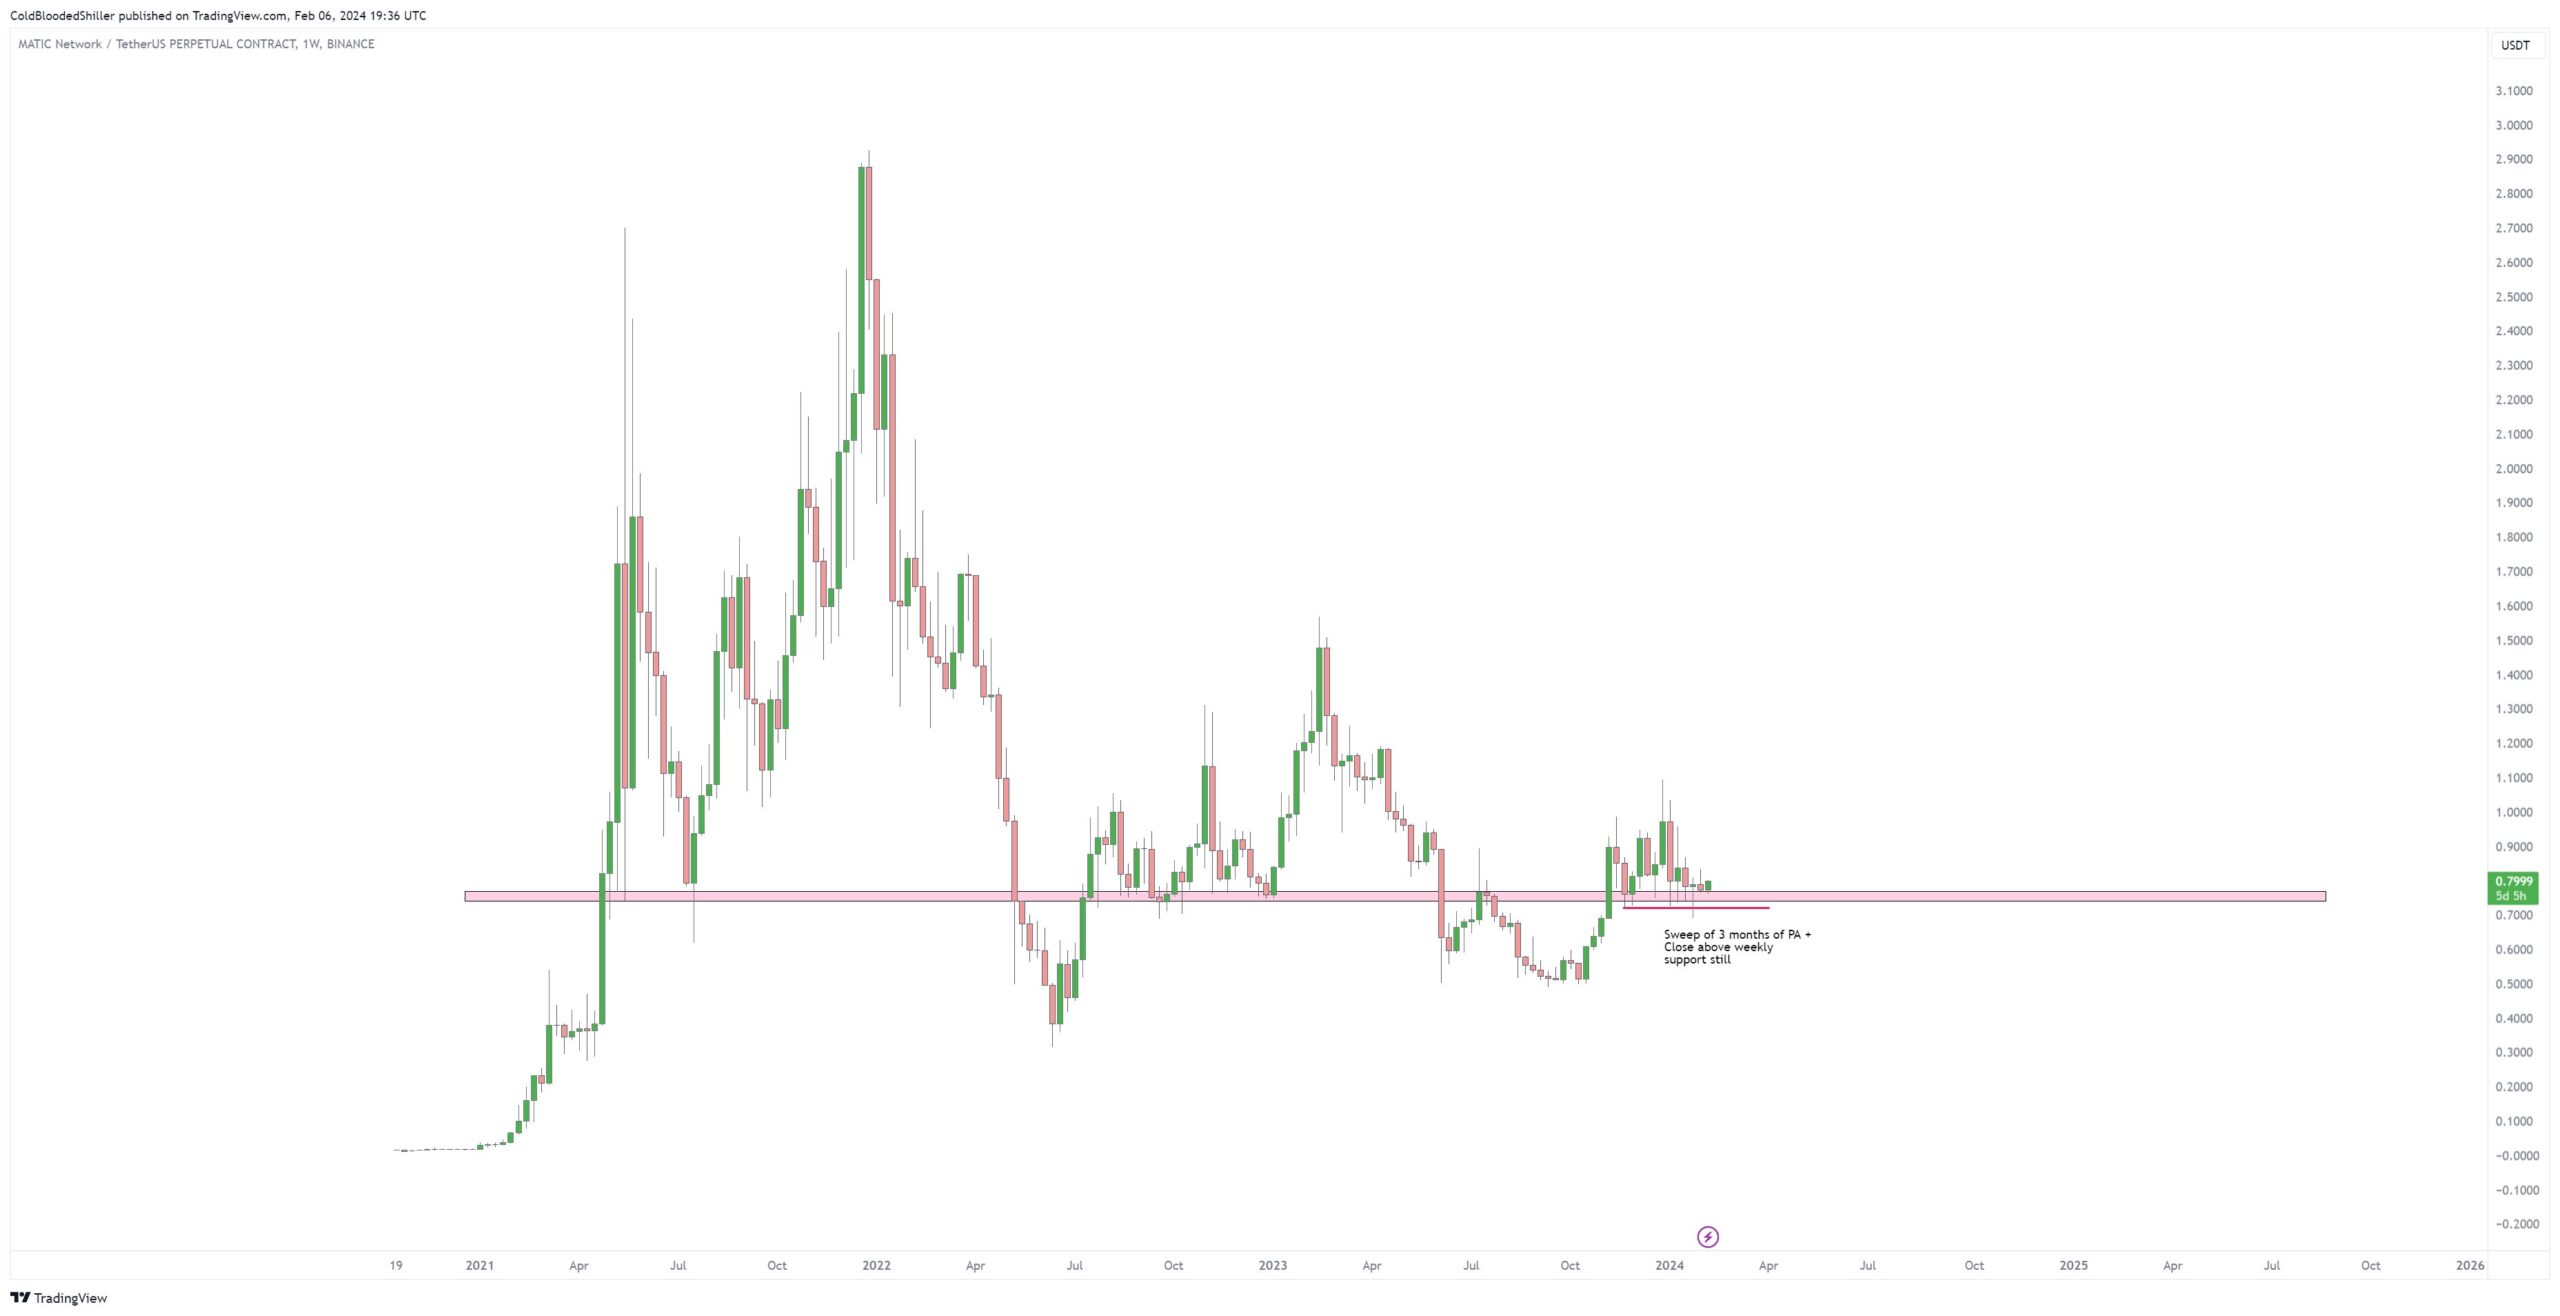 MATIC/USDT Weekly Chart. Source: X
WorldofCharts suggests that MATIC will increase by more than 50% once it breaks out from its descending wedge pattern.
CryptoAnup gives a similar outlook, though he uses a longer-term wedge for the prediction.
Read More: How To Use the Polygon Bridge: A Step-by-Step Guide
MATIC Price Prediction: Will a Bounce Take Place?The technical analysis of the daily time frame leans bullish because of the price action. MATIC bounced at the $0.72 horizontal support area on January 23 and broke out from a descending resistance trend line six days later.
While MATIC has fallen slightly since then, it trades close to the breakout level. As a result, it may be returning to validate the resistance trend line as support.
Additionally, the daily RSI is increasing. If it breaks out above 50, it will confirm the legitimacy of the upward movement. If the increase resumes, MATIC can increase over 30% to the next horizontal resistance area near $1.05.
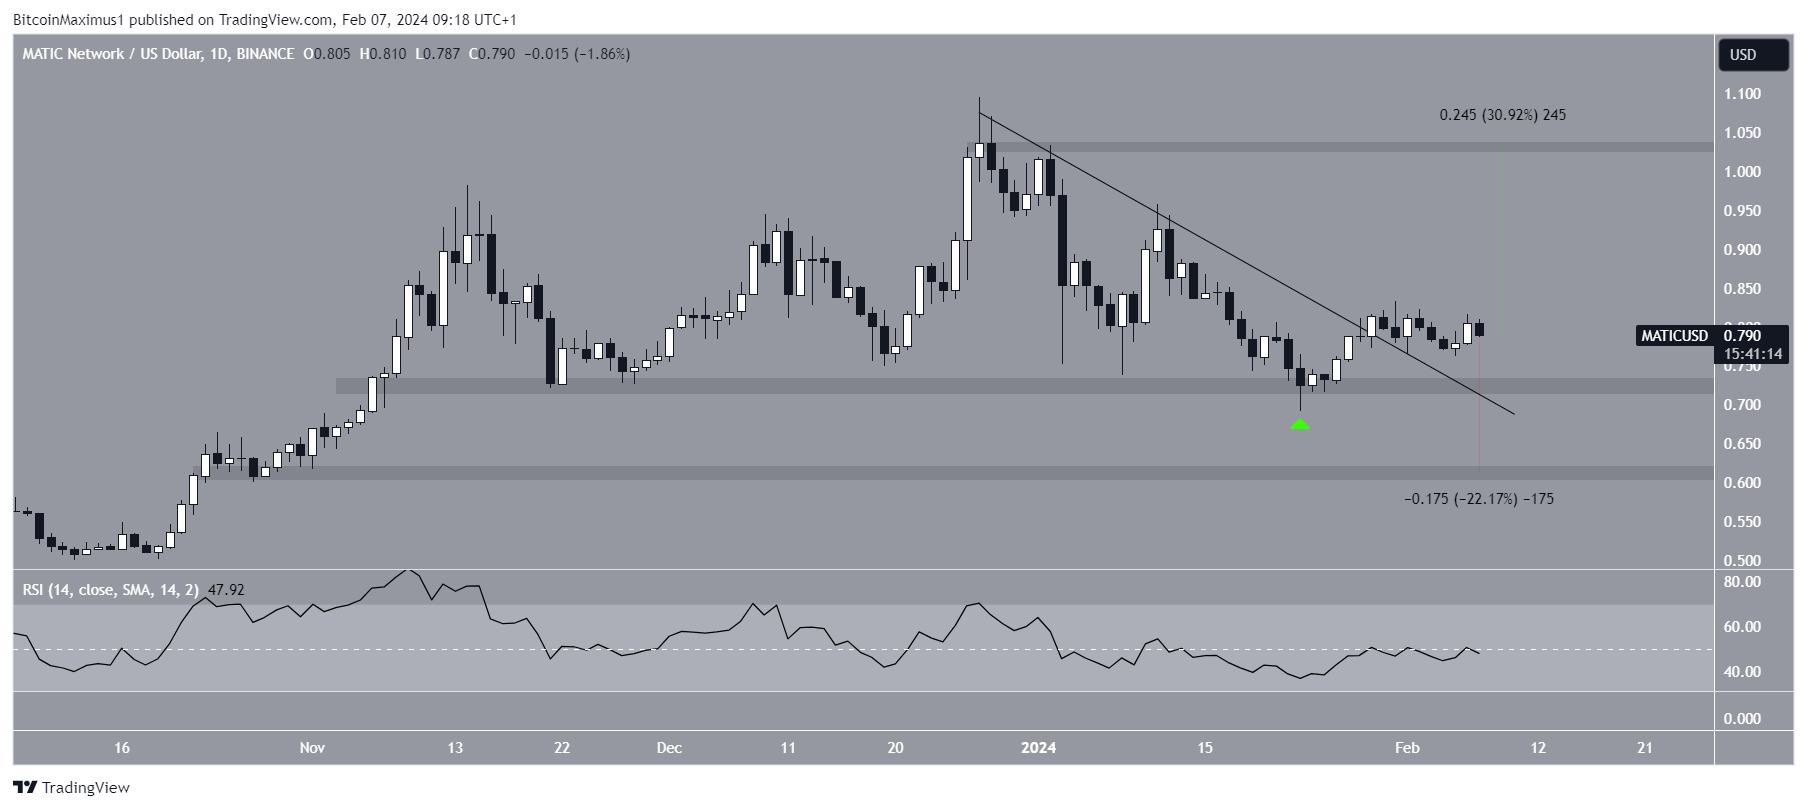 MATIC/USDT Daily Chart. Source: TradingView
Despite the bullish MATIC price prediction, a breakdown from the minor support at $0.72 will invalidate the breakout. If that happens, MATIC could fall 22% to the next closest support at $0.60.
For BeInCrypto‘s latest crypto market analysis, click here.
Top crypto platforms in the US | February 2024The post These Analysts Believe Polygon (MATIC) Will Soon Find its Footing – This is Why appeared first on BeInCrypto.