These 2 Altcoins Smash Into the Top 50 With All-Time Highs
SEI and SUI are two top 50 altcoins that reached new all-time highs today.
While SUI has increased parabolically, SEI is struggling to close above the previous all-time high resistance area. Will it do so?
SUI Parabola Leads to New All-Time HighThe SUI price has increased alongside a parabolic ascending support trend line since October 2023. The trend line has been validated numerous times, most recently on January 23, 2024 (green icon).
Since then, SUI has accelerated its rate of increase even further. Today, the altcoin reached a new all-time high of $1.97. Furthermore, the Relative Strength Index (RSI) gives a positive reading.
When evaluating market conditions, traders use the RSI as a momentum indicator to determine whether a market is overbought or oversold and whether to accumulate or sell an asset.
If the RSI reading is above 50 and the trend is upward, bulls still have an advantage, but if the reading is below 50, the opposite is true. The RSI is above 50 and increasing both bullish signs.
If the upward movement continues, the next resistance is 15% above the current SUI price at $2.20. It is created by the 1.61 external Fib retracement of the previous drop.
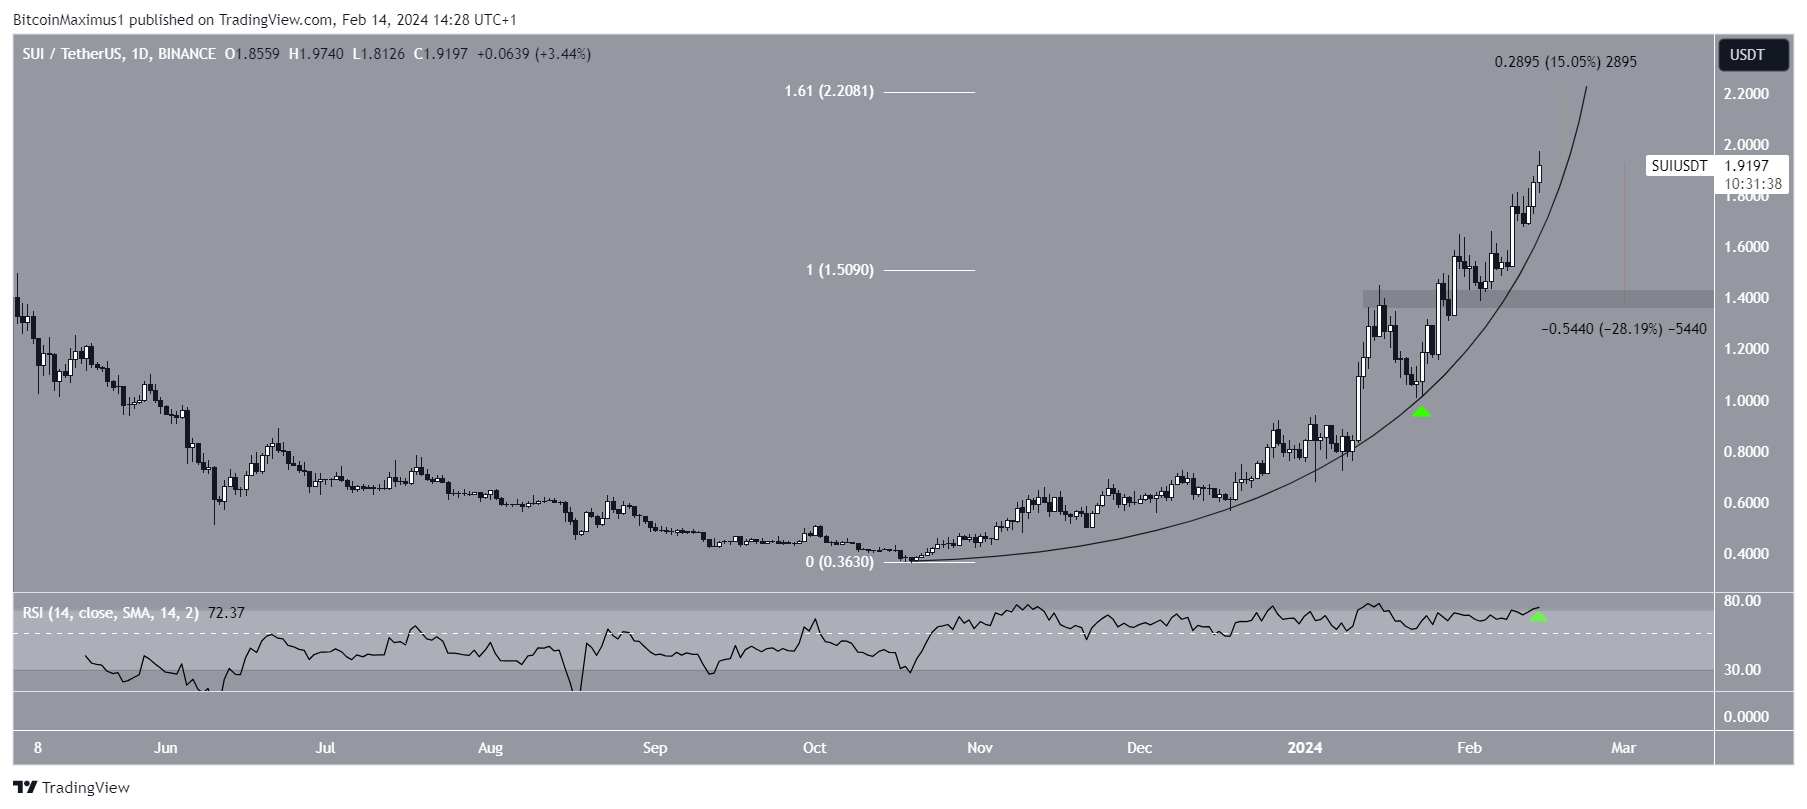 SUI/USDT Daily Chart. Source: TradingView
Despite this bullish SUI price prediction, a breakdown from the parabola can trigger a 28% drop to the closest support at $1.40.
Read More: Everything You Need to Know About the Sui Blockchain
Can SEI Price Reach a Close Above Resistance?The SEI price has increased rapidly since December 2023. The upward movement led to an all-time high of $0.88 on January 4, 2024. Afterward, the price began moving downward, validating the $0.85 horizontal area as resistance.
The downward movement stopped on January 23. After creating a higher low on February 7, the altcoin accelerated its increase and broke out from the $0.85 area today, reaching a new all-time high of $0.90.
Read More: Top Marketplaces to Buy Ordinals
The RSI is increasing and moving above 70, both signs of a bullish trend.
The wave count also suggests the increase will continue. Utilizing the Elliott Wave theory, technical analysts examine long-term price patterns and investor psychology that recur to determine the direction of a trend.
The most likely count indicates that SEI is in the fifth and final wave of its increase, which could culminate with a high near $1.08, 26% above the current price.
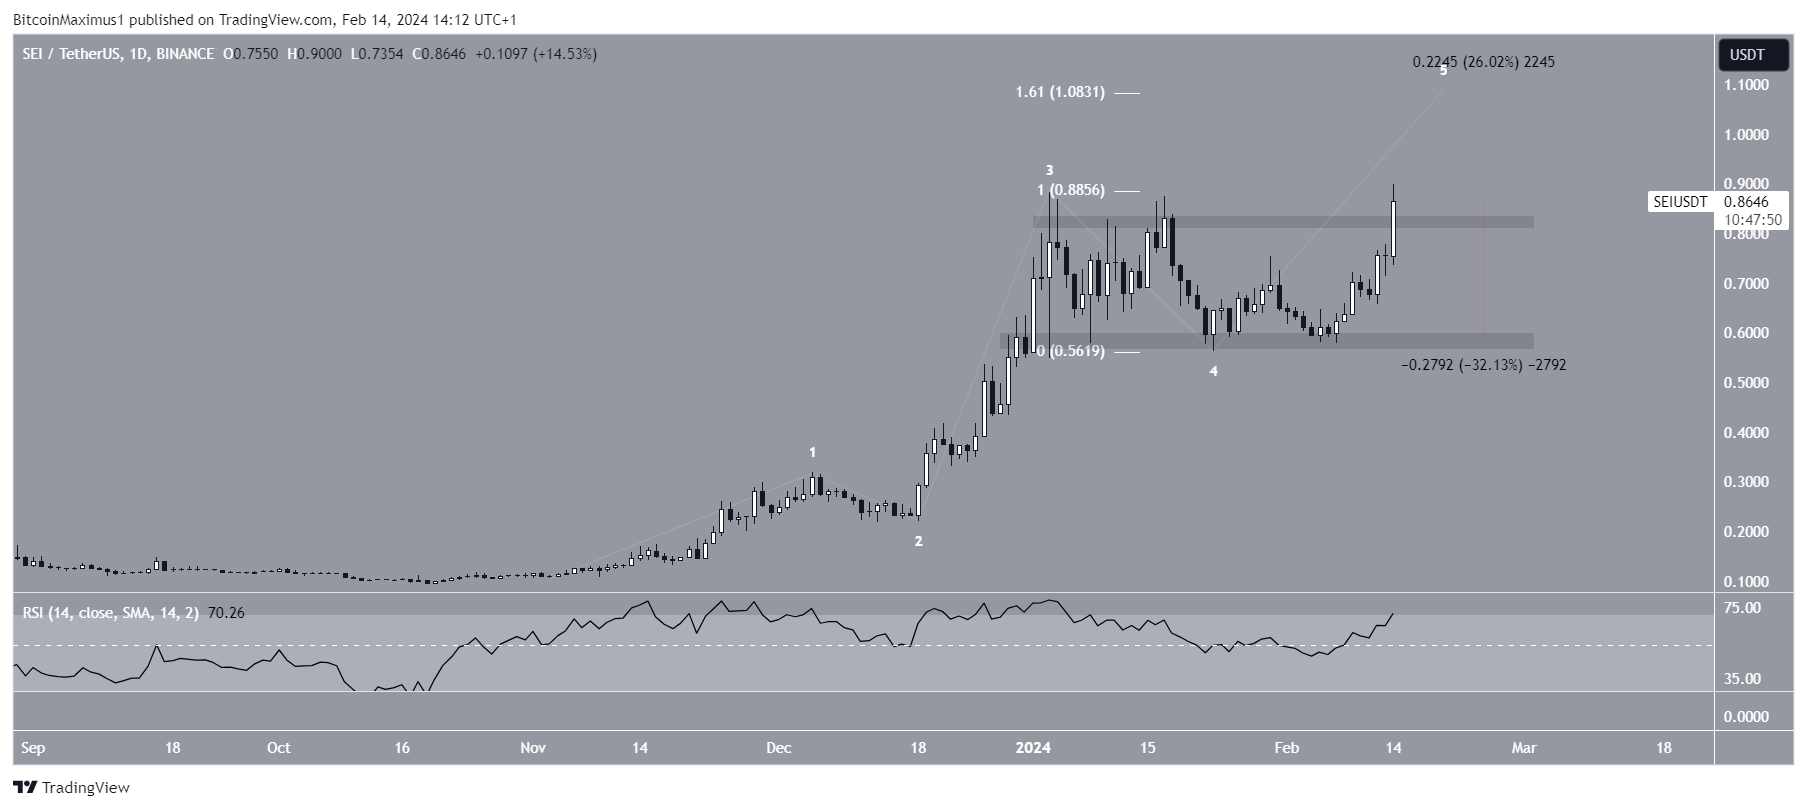 SEI/USDT Daily Chart. Source: TradingView
Despite the bullish SEI price prediction, a rejection from the $0.85 area can trigger a 32% drop to the closest support at $0.60.
Read More: Top 5 Crypto Companies That Might Go Public in 2024
For BeInCrypto‘s latest crypto market analysis, click here.
Best crypto platforms in Europe | February 2024The post These 2 Altcoins Smash Into the Top 50 With All-Time Highs appeared first on BeInCrypto.