Solana (SOL) Hits $130: Is a Price Upswing on the Horizon?
The Solana price has undergone a significant correction from approximately $210 to about $116 over recent weeks. However, there is now potential for an upswing.
After our prior caution regarding a substantial correction in Solana when the price hovered around $190, the price has indeed declined by approximately 39%. Consequently, Solana has reached the correction target of around $130.
Solana’s Rough Patch: A 43.3% Decrease in PriceThe correction in SOL’s price has been relatively moderate thus far, with the price dropping by over 43% this month.
Consequently, the histogram of the Moving Average Convergence/Divergence (MACD) is also beginning to trend lower in a bearish direction this month. However, the MACD lines maintain a bullish crossover in the monthly chart, while the Relative Strength Index (RSI) is gradually transitioning into neutral territory.
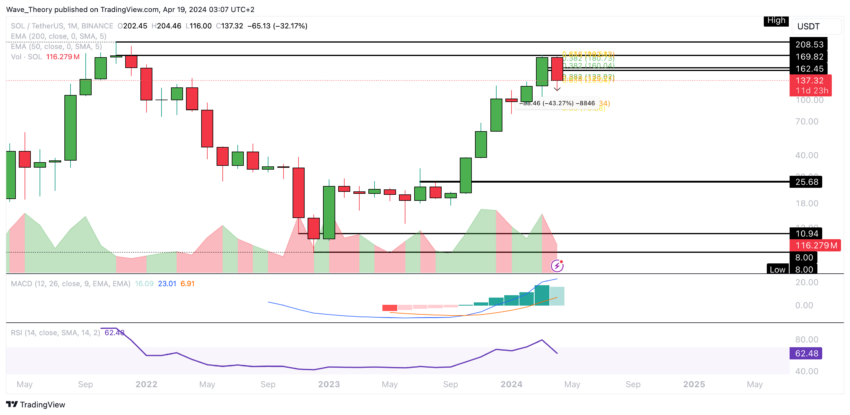 Solana (SOL/USDT) Price Chart. Source: Tradingview
In summary, the bullish upward trend remains sustained as long as Solana maintains support above the golden ratio level at approximately $85.
Read More: 6 Best Platforms To Buy Solana (SOL) in 2024
Will Solana Hold Above $130? Analyzing Golden Ratio Support ImpactSignificant Fibonacci support lies within the range of $125 to $130 for the SOL price. Maintaining above this range would signal a strong bullish sentiment.
Alternatively, the 50-week EMA at approximately $85 stands as an additional support level. Weekly chart indicators portray a bearish outlook, with the MACD histogram trending downward and the MACD lines nearing a bearish crossover.
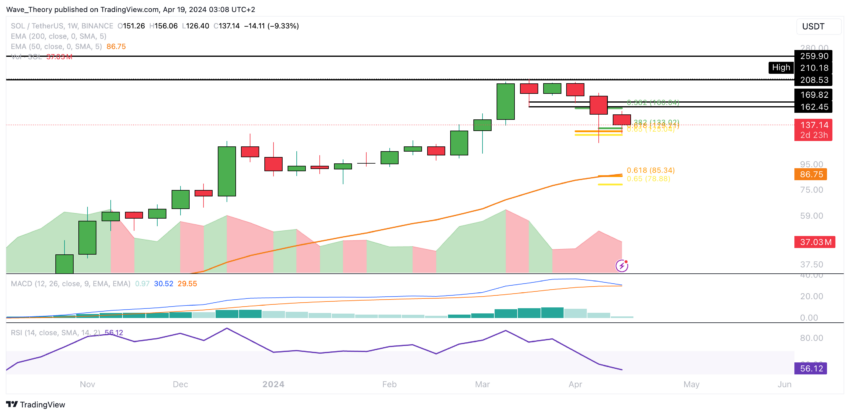 Solana (SOL/USDT) Price Chart. Source: Tradingview
Meanwhile, the RSI remains in neutral territory.
Forecasting Solana: Key Fibonacci Resistance Levels to WatchIf Solana rebounds from the Golden Ratio support around $125, it could encounter significant resistance at the 50-day EMA around $156.6. Breaking through the golden ratio at $175 is necessary to halt the corrective movement, although horizontal resistance is present between $162.5 and $170.
Indicators offer mixed signals: the MACD histogram has shown bullish momentum for three days, and there’s a golden crossover in the EMAs, indicating a bullish trend in the short to medium term. However, the RSI remains neutral, and the MACD lines are currently bearishly crossed.
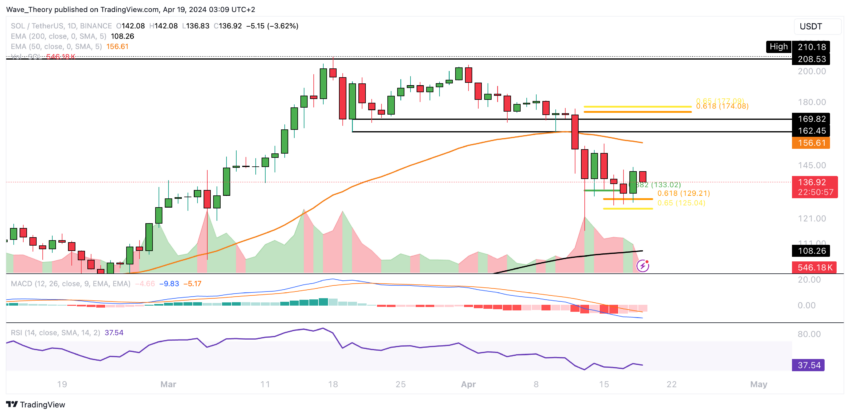 Solana (SOL/USDT) Price Chart. Source: Tradingview
Should the current Fibonacci support falter, Solana may find support at the 200-day EMA near $108 before potentially correcting to the golden ratio at approximately $85.
Bearish Pattern: Death Cross Emerges on Solana’s 4-Hour ChartThe recent formation of a death cross in Solana’s 4-hour chart confirms a short-term bearish trend, indicating a potential downward movement toward the Golden Ratio support zone between $125 and $130.
Despite this, the MACD lines remain bullish, and the RSI hovers in neutral territory.
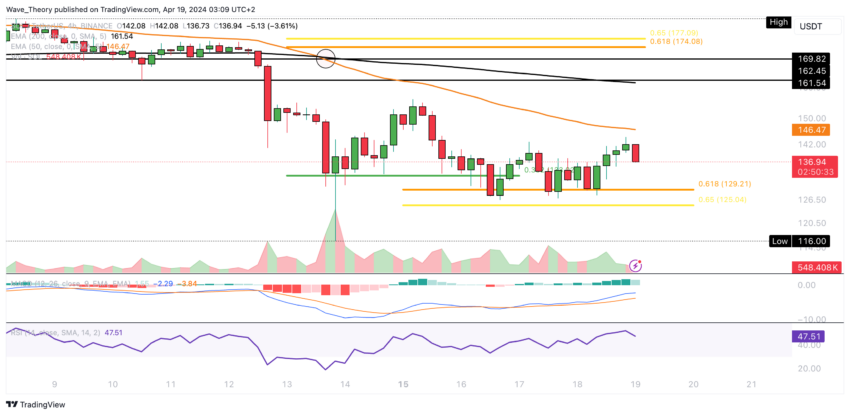 Solana (SOL/USDT) Price Chart. Source: Tradingview
However, the MACD histogram is starting to show bearish momentum with a downward tick.
Solana vs. Bitcoin: Solana Hits Crucial Fibonacci Support LevelAgainst Bitcoin, Solana currently finds itself at Fibonacci support levels ranging between approximately 0.0021 BTC and 0.0023 BTC. This presents a potential opportunity for a bullish rebound.
Read More: Solana (SOL) Price Prediction 2024/2025/2030
However, it’s worth noting that Solana has been experiencing a downward trend over the past five weeks following a bearish rejection at the Golden Ratio resistance of around 0.003 BTC.
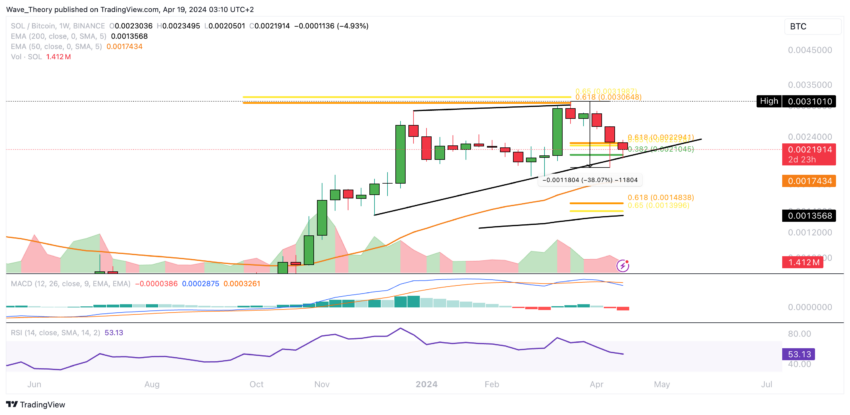 Solana (SOL/BTC) Price Chart. Source: Tradingview
The MACD lines have crossed bearishly, accompanied by a downward trend in the MACD histogram, while the RSI remains in neutral territory.
The post Solana (SOL) Hits $130: Is a Price Upswing on the Horizon? appeared first on BeInCrypto.