Solana Shows Signs of Recovery: Key Indicators Signal Upward Momentum
Solana’s (SOL) price nearly broke below its crucial support level of $126. Since early March, this support has prevented a significant drop in price.
However, the cryptocurrency is now showing signs of recovery. Investors are keen to determine if SOL is on the verge of a price rally, especially as technical indicators point to a potential upward movement.
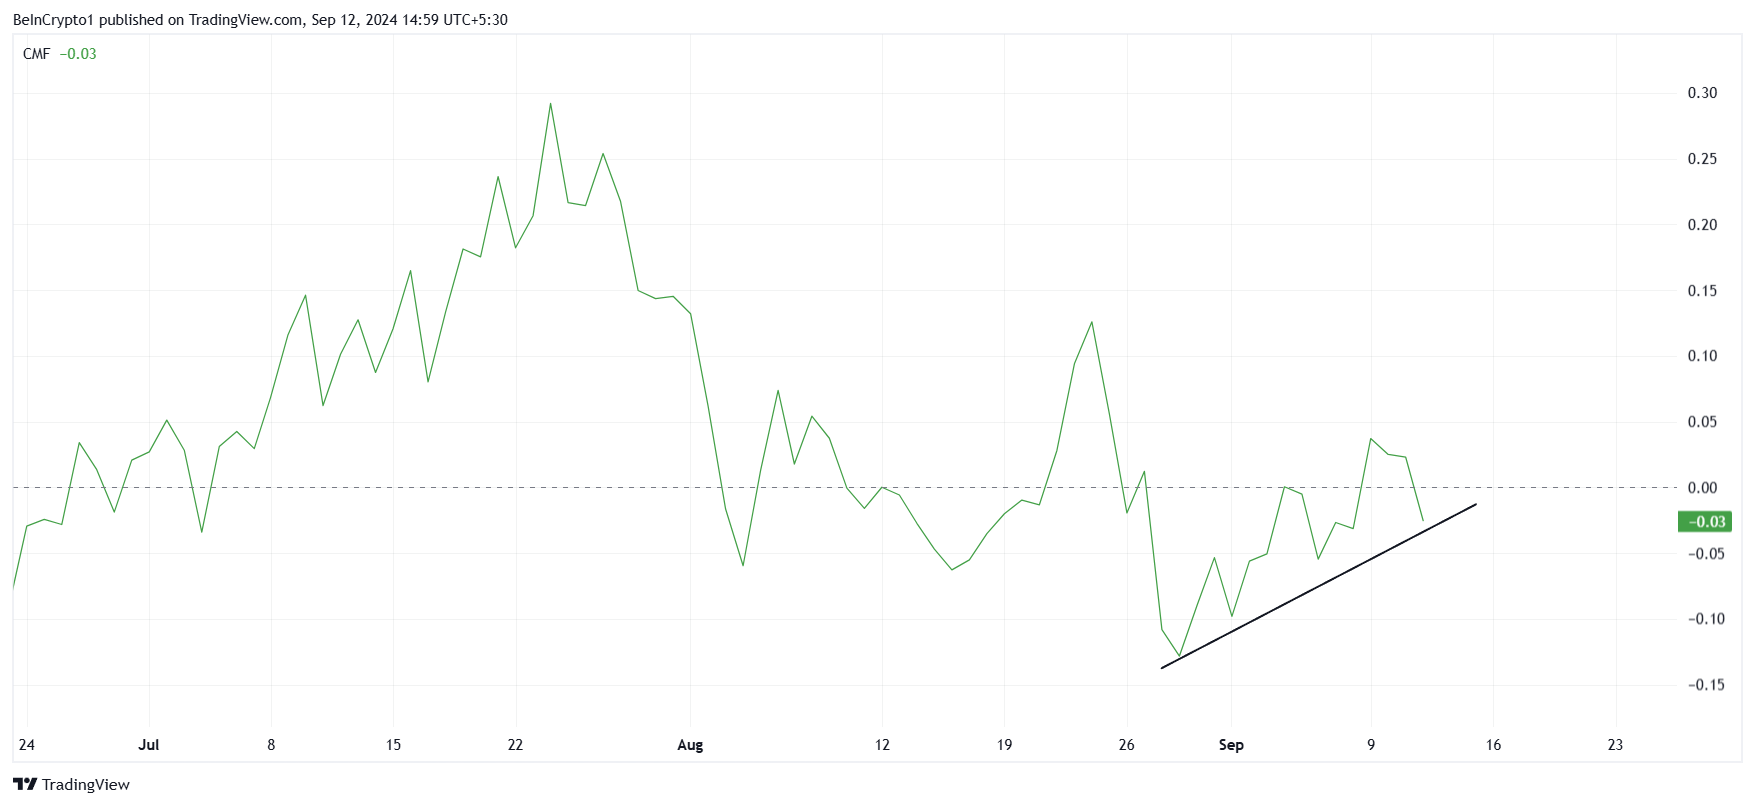
Solana Has Investors’ IntentionThe Chaikin Money Flow (CMF) indicator, which tracks the inflow and outflow of capital into an asset, is currently showing a notable uptick for Solana. This is a strong sign that the cryptocurrency is seeing consistent buying pressure, which could be a precursor to a price rally. However, despite the uptick, netflows remain negative, indicating that there is still some outflow of capital, which could limit the strength of this momentum.
For the rally to fully take hold, the CMF must cross above the zero line. When this occurs, it would signal that netflows have turned positive, bolstering confidence in Solana’s price recovery.
Read more: 11 Top Solana Meme Coins to Watch in August 2024
 Solana CMF. Source: TradingView
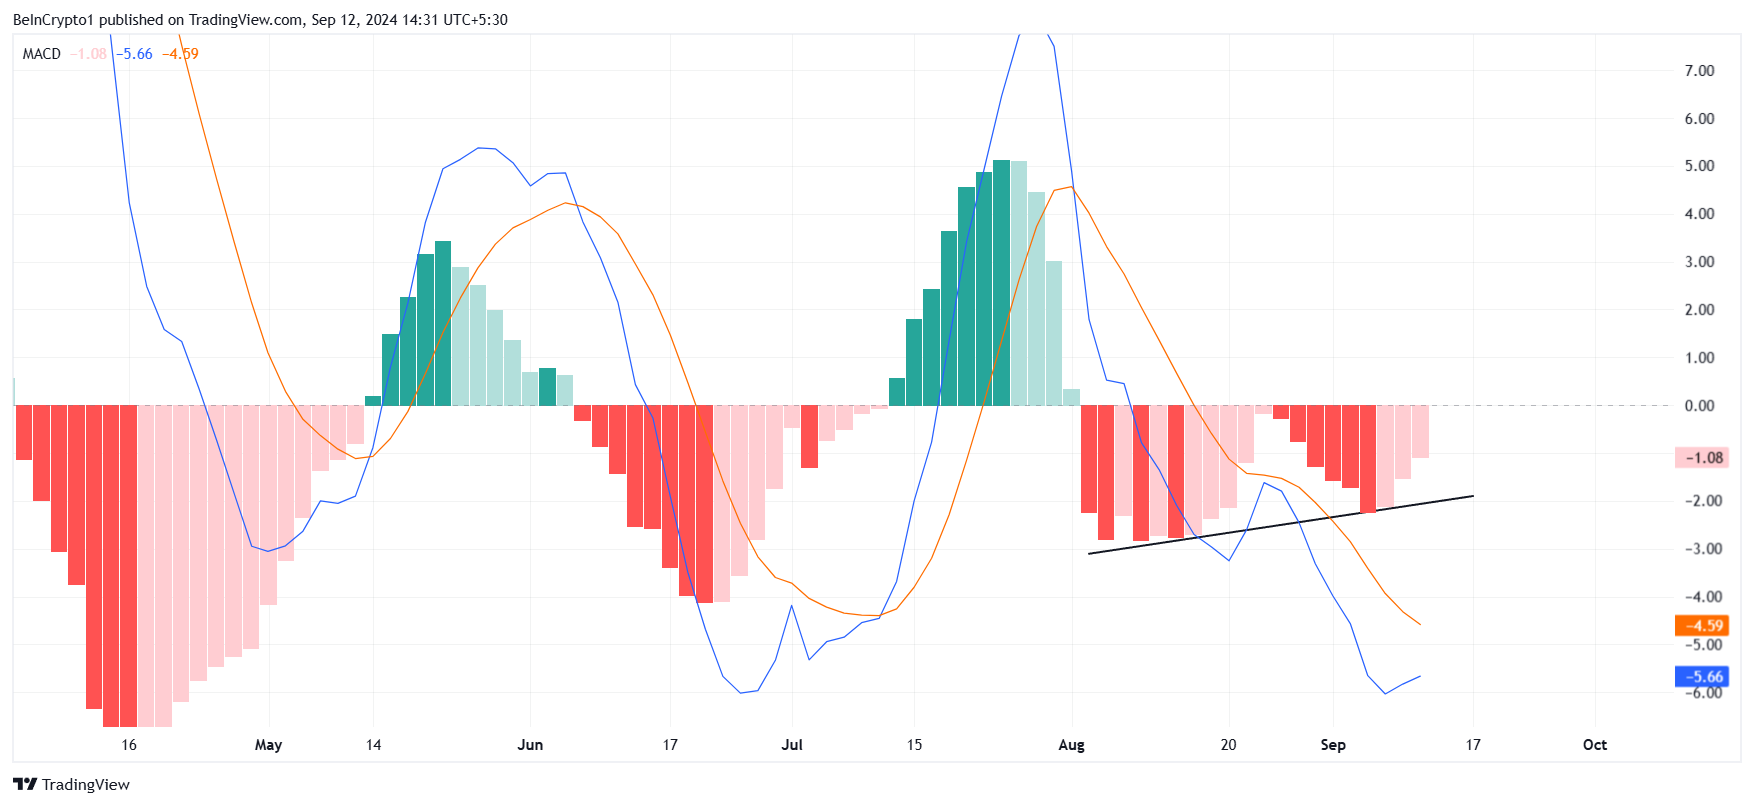
Looking at Solana’s macro momentum, the Moving Average Convergence Divergence (MACD) is forming a double-bottom divergence pattern. This is often considered a key indicator of a potential reversal in market sentiment. In the case of Solana, this divergence suggests that bearish momentum is weakening, and bullishness is gradually gaining strength.
A double bottom in the MACD often signals a significant shift in trend. For SOL, this pattern hints at a potential price rise ahead. The recent uptrend, coupled with these technical signals, provides an optimistic outlook for long-term holders and traders alike.
 Solana MACD. Source: TradingView
Solana Price Prediction: Rally Incoming?
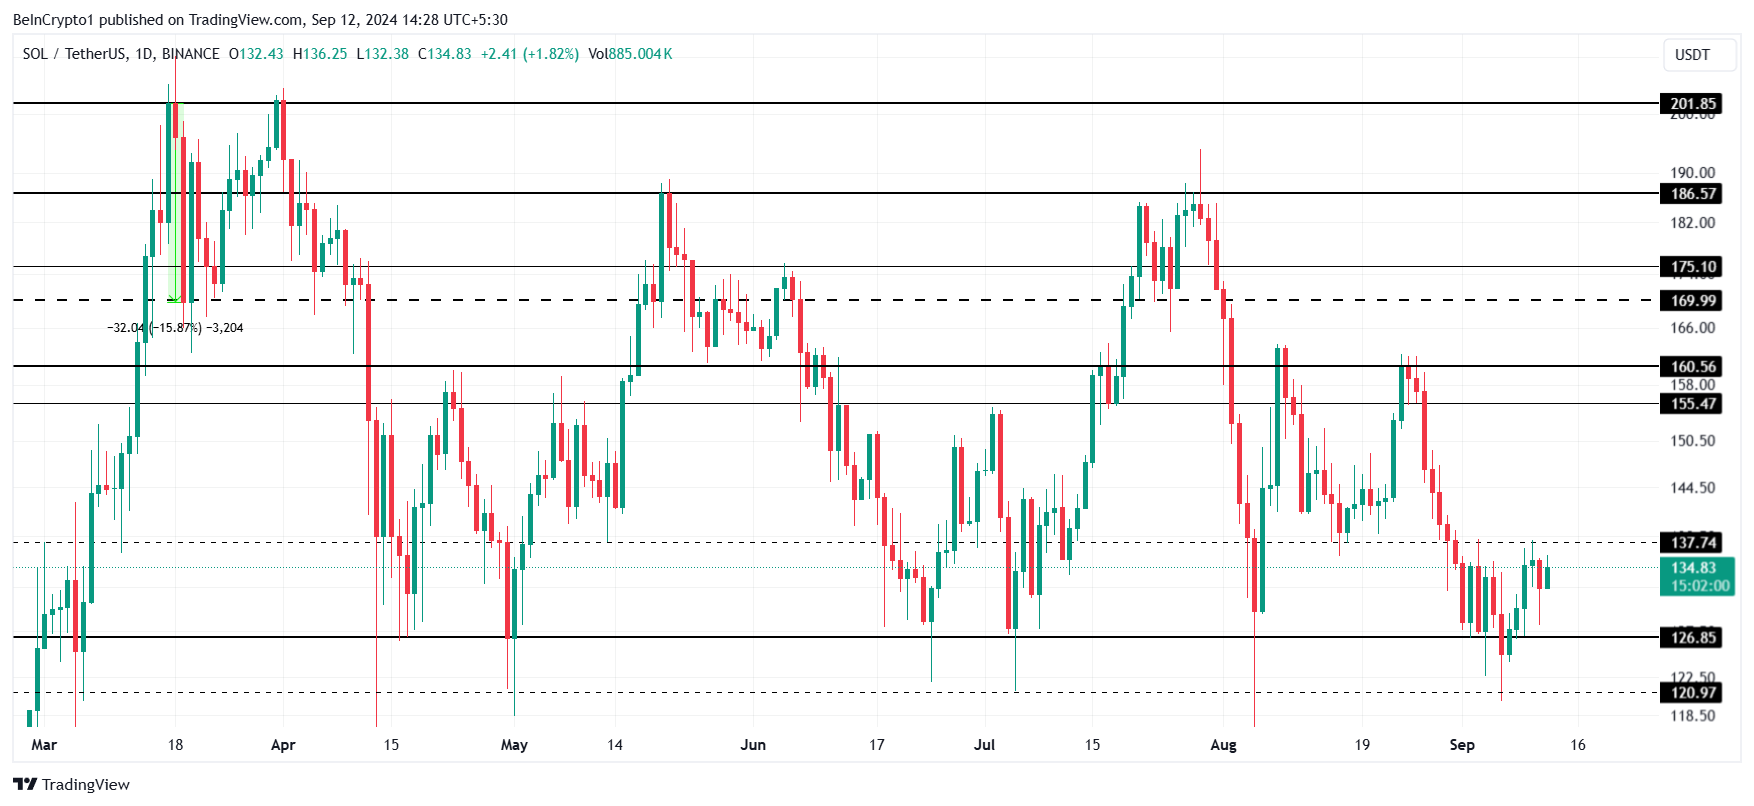
Solana’s price has been fluctuating between $186 and $126 over the past several weeks. Short-term consolidation is occurring under the $160 level, with the current price of $134 hovering around the local resistance of $137. To maintain upward momentum, SOL needs to break through this local resistance.
Given the strong technical indicators, including the CMF and MACD, it’s likely that Solana will flip this $137 barrier into support and bounce higher. If this happens, the next target for the altcoin is $155, followed by a more critical resistance level of $160. Surpassing $160 could open the door for further price gains.
Read more: Solana (SOL) Price Prediction 2024/2025/2030
 Solana Price Analysis. Source: TradingView
However, if Solana fails to break above $137, it could fall back to its previous support at $126. This scenario would invalidate the bullish thesis and may lead to prolonged consolidation, trapping the price within a tighter range.
The post Solana Shows Signs of Recovery: Key Indicators Signal Upward Momentum appeared first on BeInCrypto.
