Solana’s (SOL) Emerging Death Cross Means Losses for Traders
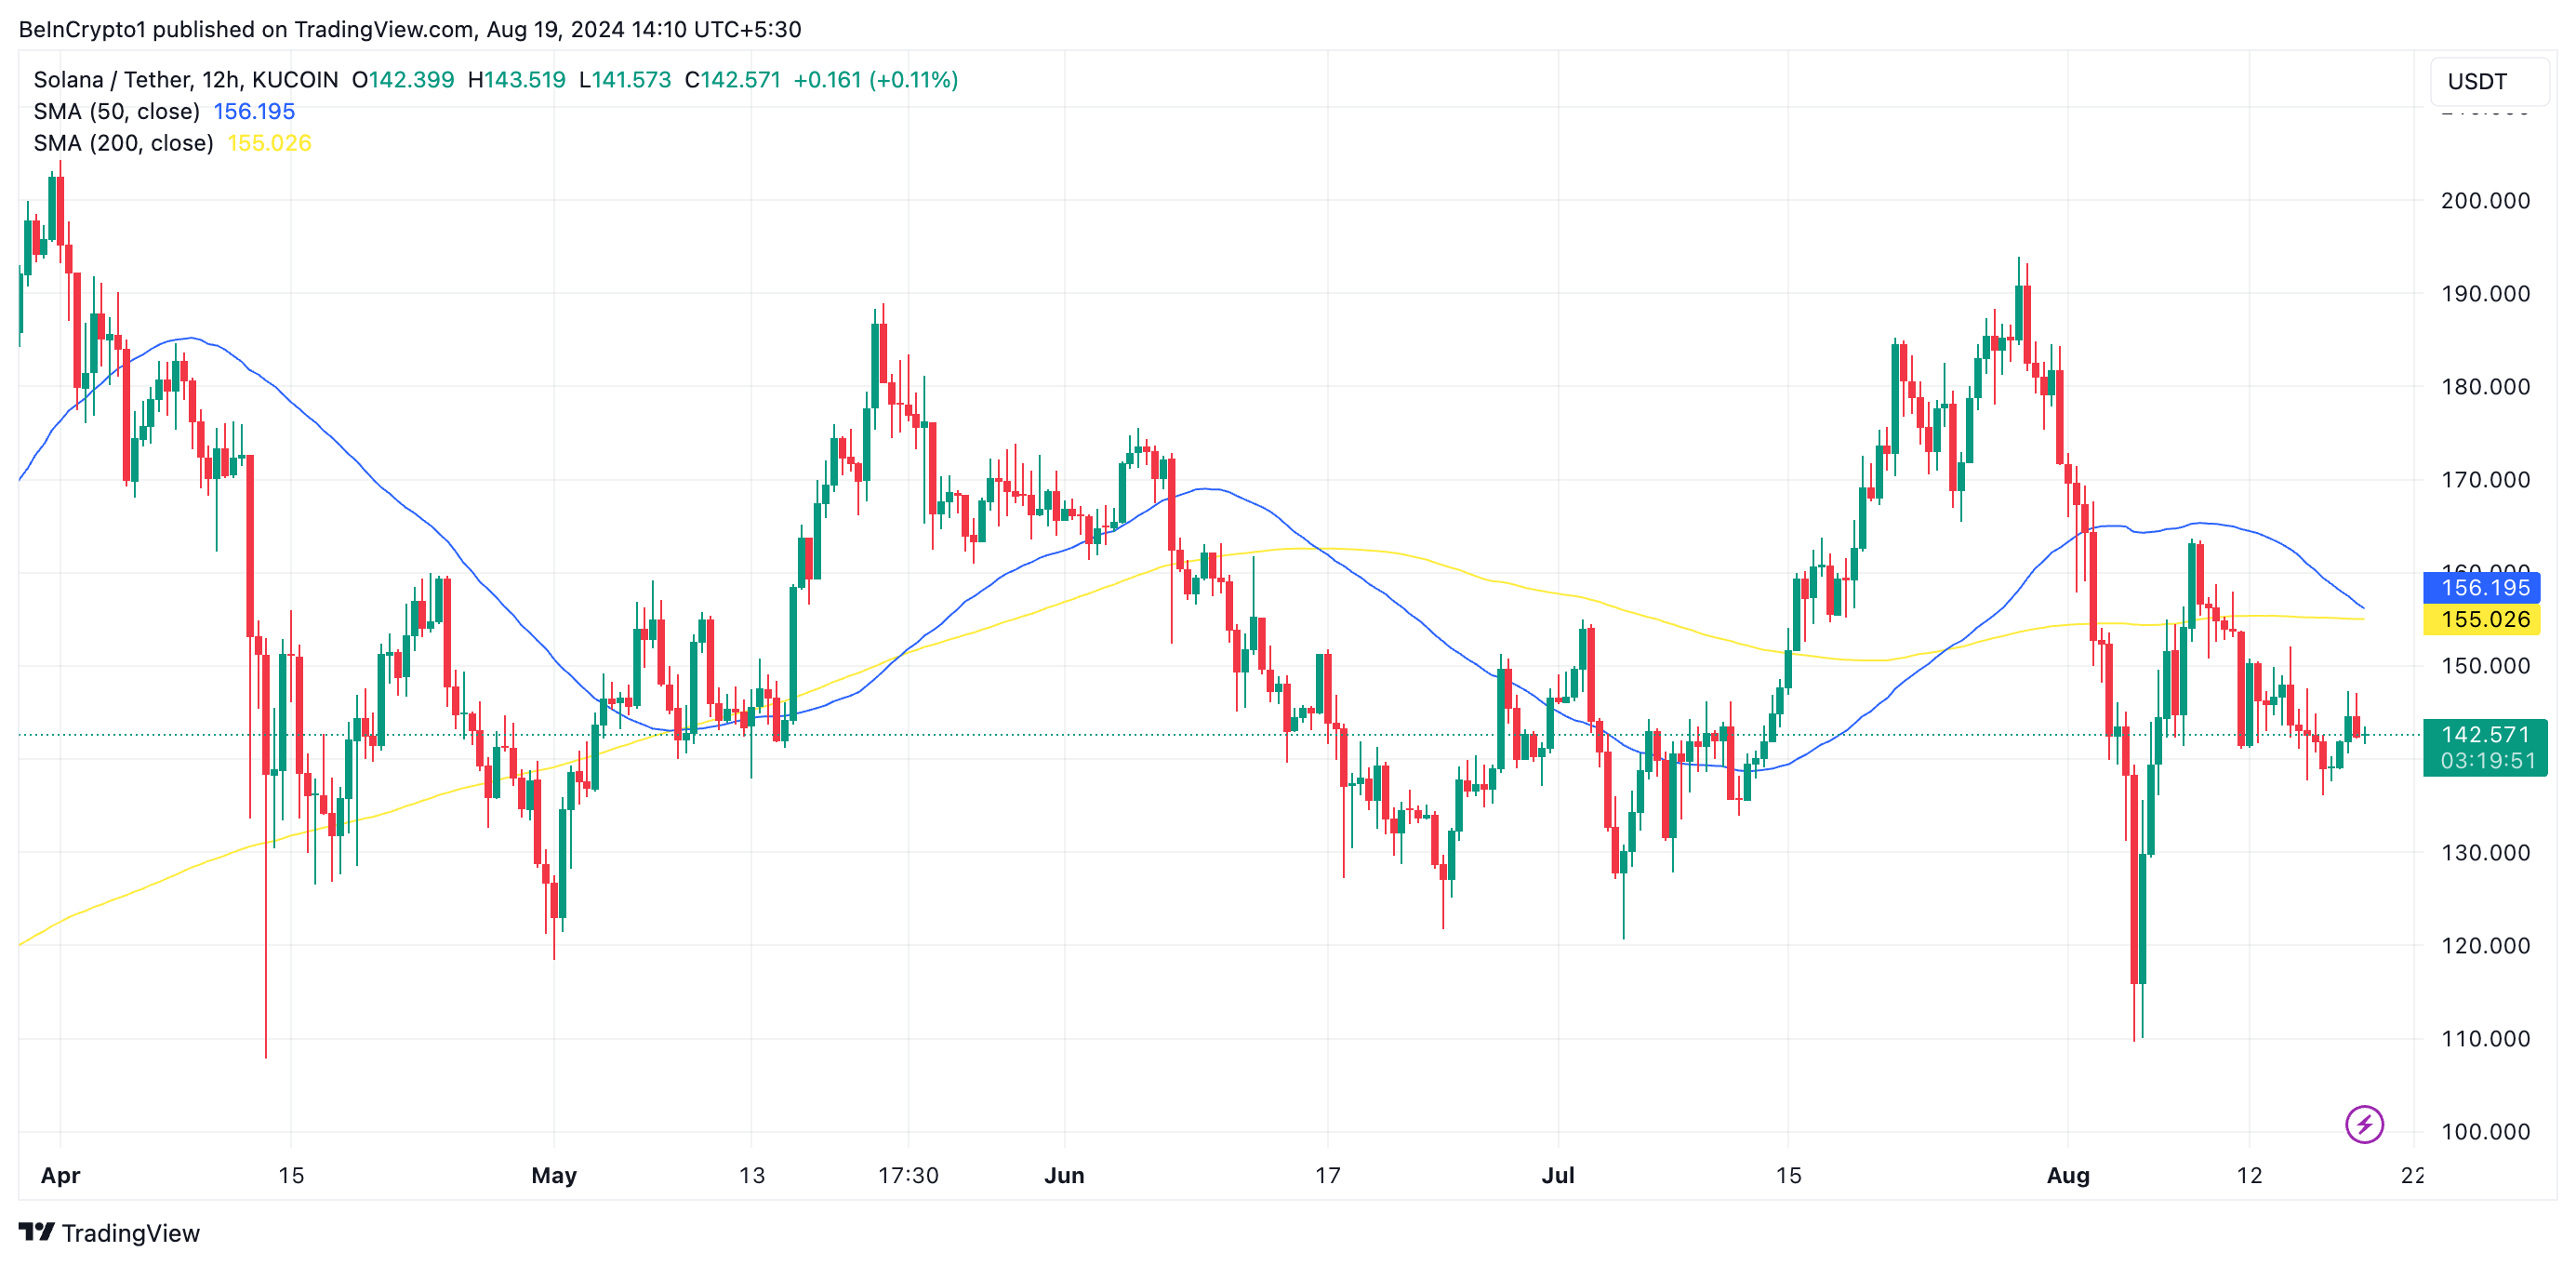
Solana risks devaluation as technical indicators point to a potential downturn. On the 12-hour chart, a developing death cross is emerging.
If confirmed, the death cross may cause SOL’s price to plummet below $110.
Solana and its Forming Death CrossSolana’s 12-hour chart indicates that its 50-day SMA (blue line) is trending downward toward the 200-day SMA (yellow line), suggesting an impending death cross — a bearish signal indicating potential downside. Traders usually interpret it as a sign to exit long and take short positions.
 Solana 12-Hour Analysis. Source: TradingView
An assessment of some key indicators confirms the growing bearish bias toward the altcoin, which makes the death cross likely.
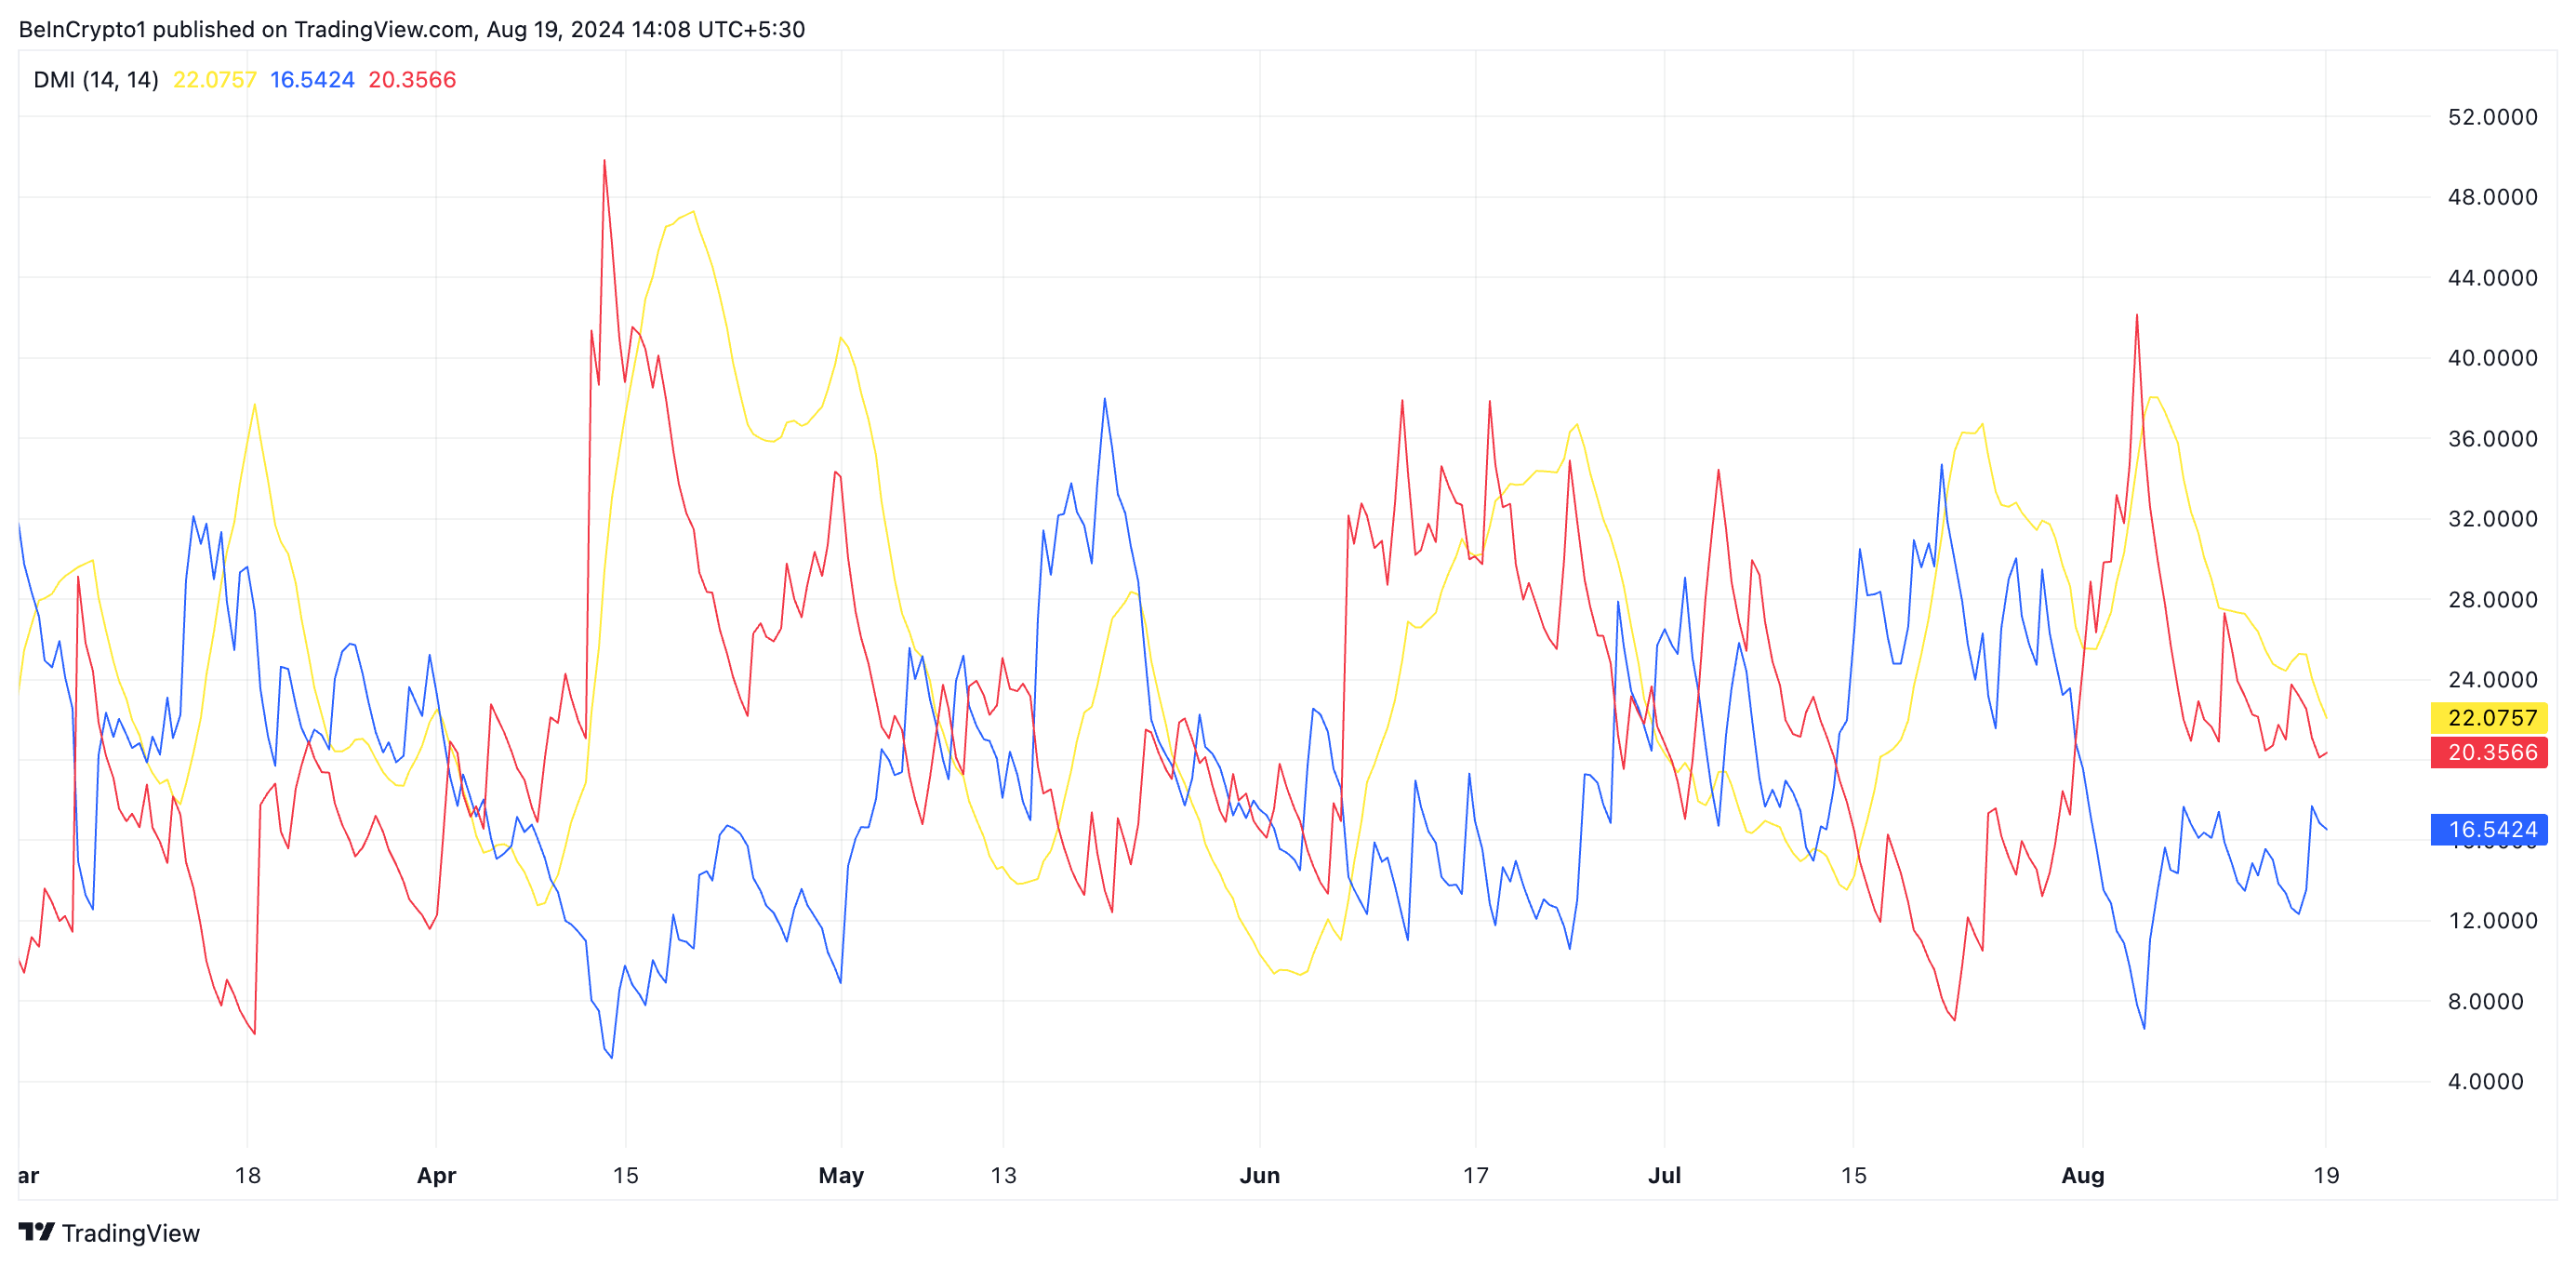
Firstly, the setup of Solana’s Directional Movement Index (DMI) shows significant bearish strength in the market. As of this writing, SOL’s Positive Directional Indicator (+DI) rests below its Negative Directional Indicator (-DI). The +DI measures the strength of upward price movements, while the -DI measures the strength of a price downtrend.
 Solana’s Directional Movement Index. Source: TradingView
When set this way, the downtrend is strong. This suggests that sellers are in control, and bearish momentum is dominating the market. Exchanging hands at $142.69 as of this writing, SOL’s price has plunged by 16% in the last month.
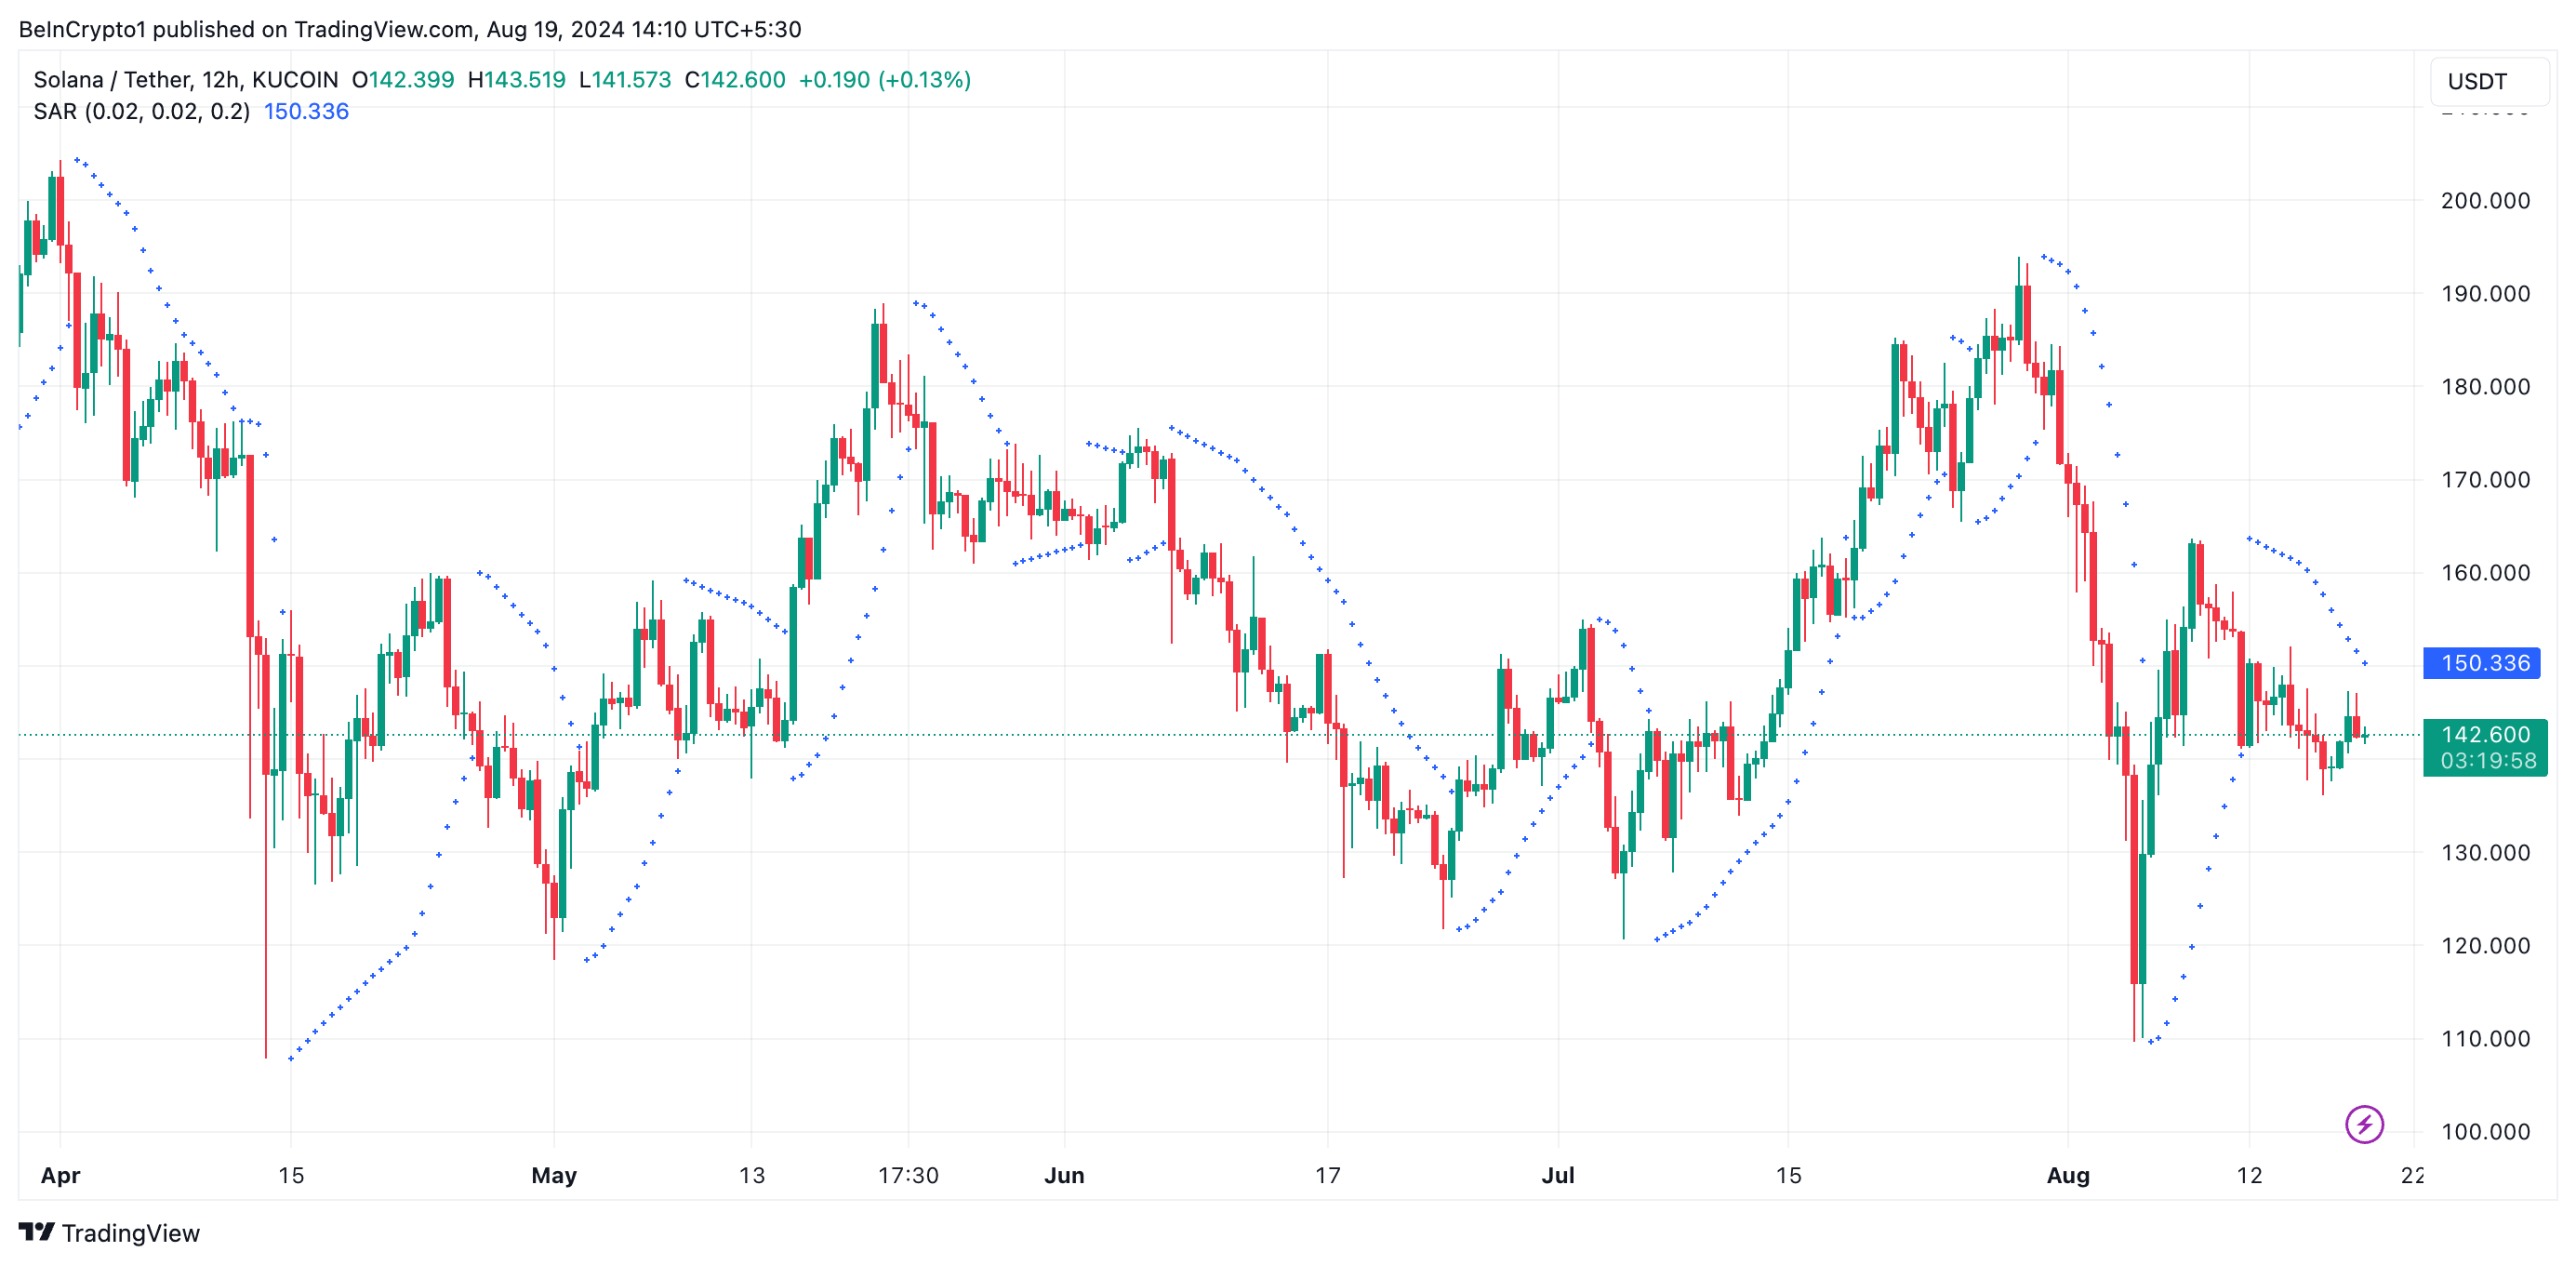
Also, the dots of SOL’s Parabolic Stop and Reverse (SAR) indicator lie above its price. This indicator tracks an asset’s price direction and identifies potential reversal points.
Read more: 6 Best Platforms To Buy Solana (SOL) in 2024

Solana Parabolic Stop and Reverse. Source: TradingView
When its dots rest above the asset’s price, the market trend is downward. It offers confirmation that the asset’s price is declining and that the downtrend may continue.
SOL Price Prediction: a Drop Below $110SOL’s negative funding rate on exchanges in the past few weeks lends credence to the above position. This means there is a higher demand for short positions amongst the altcoin’s futures traders. At press time, SOL’s funding rate is -0.0028%.
 Solana Funding Rate. Source: Coinglass
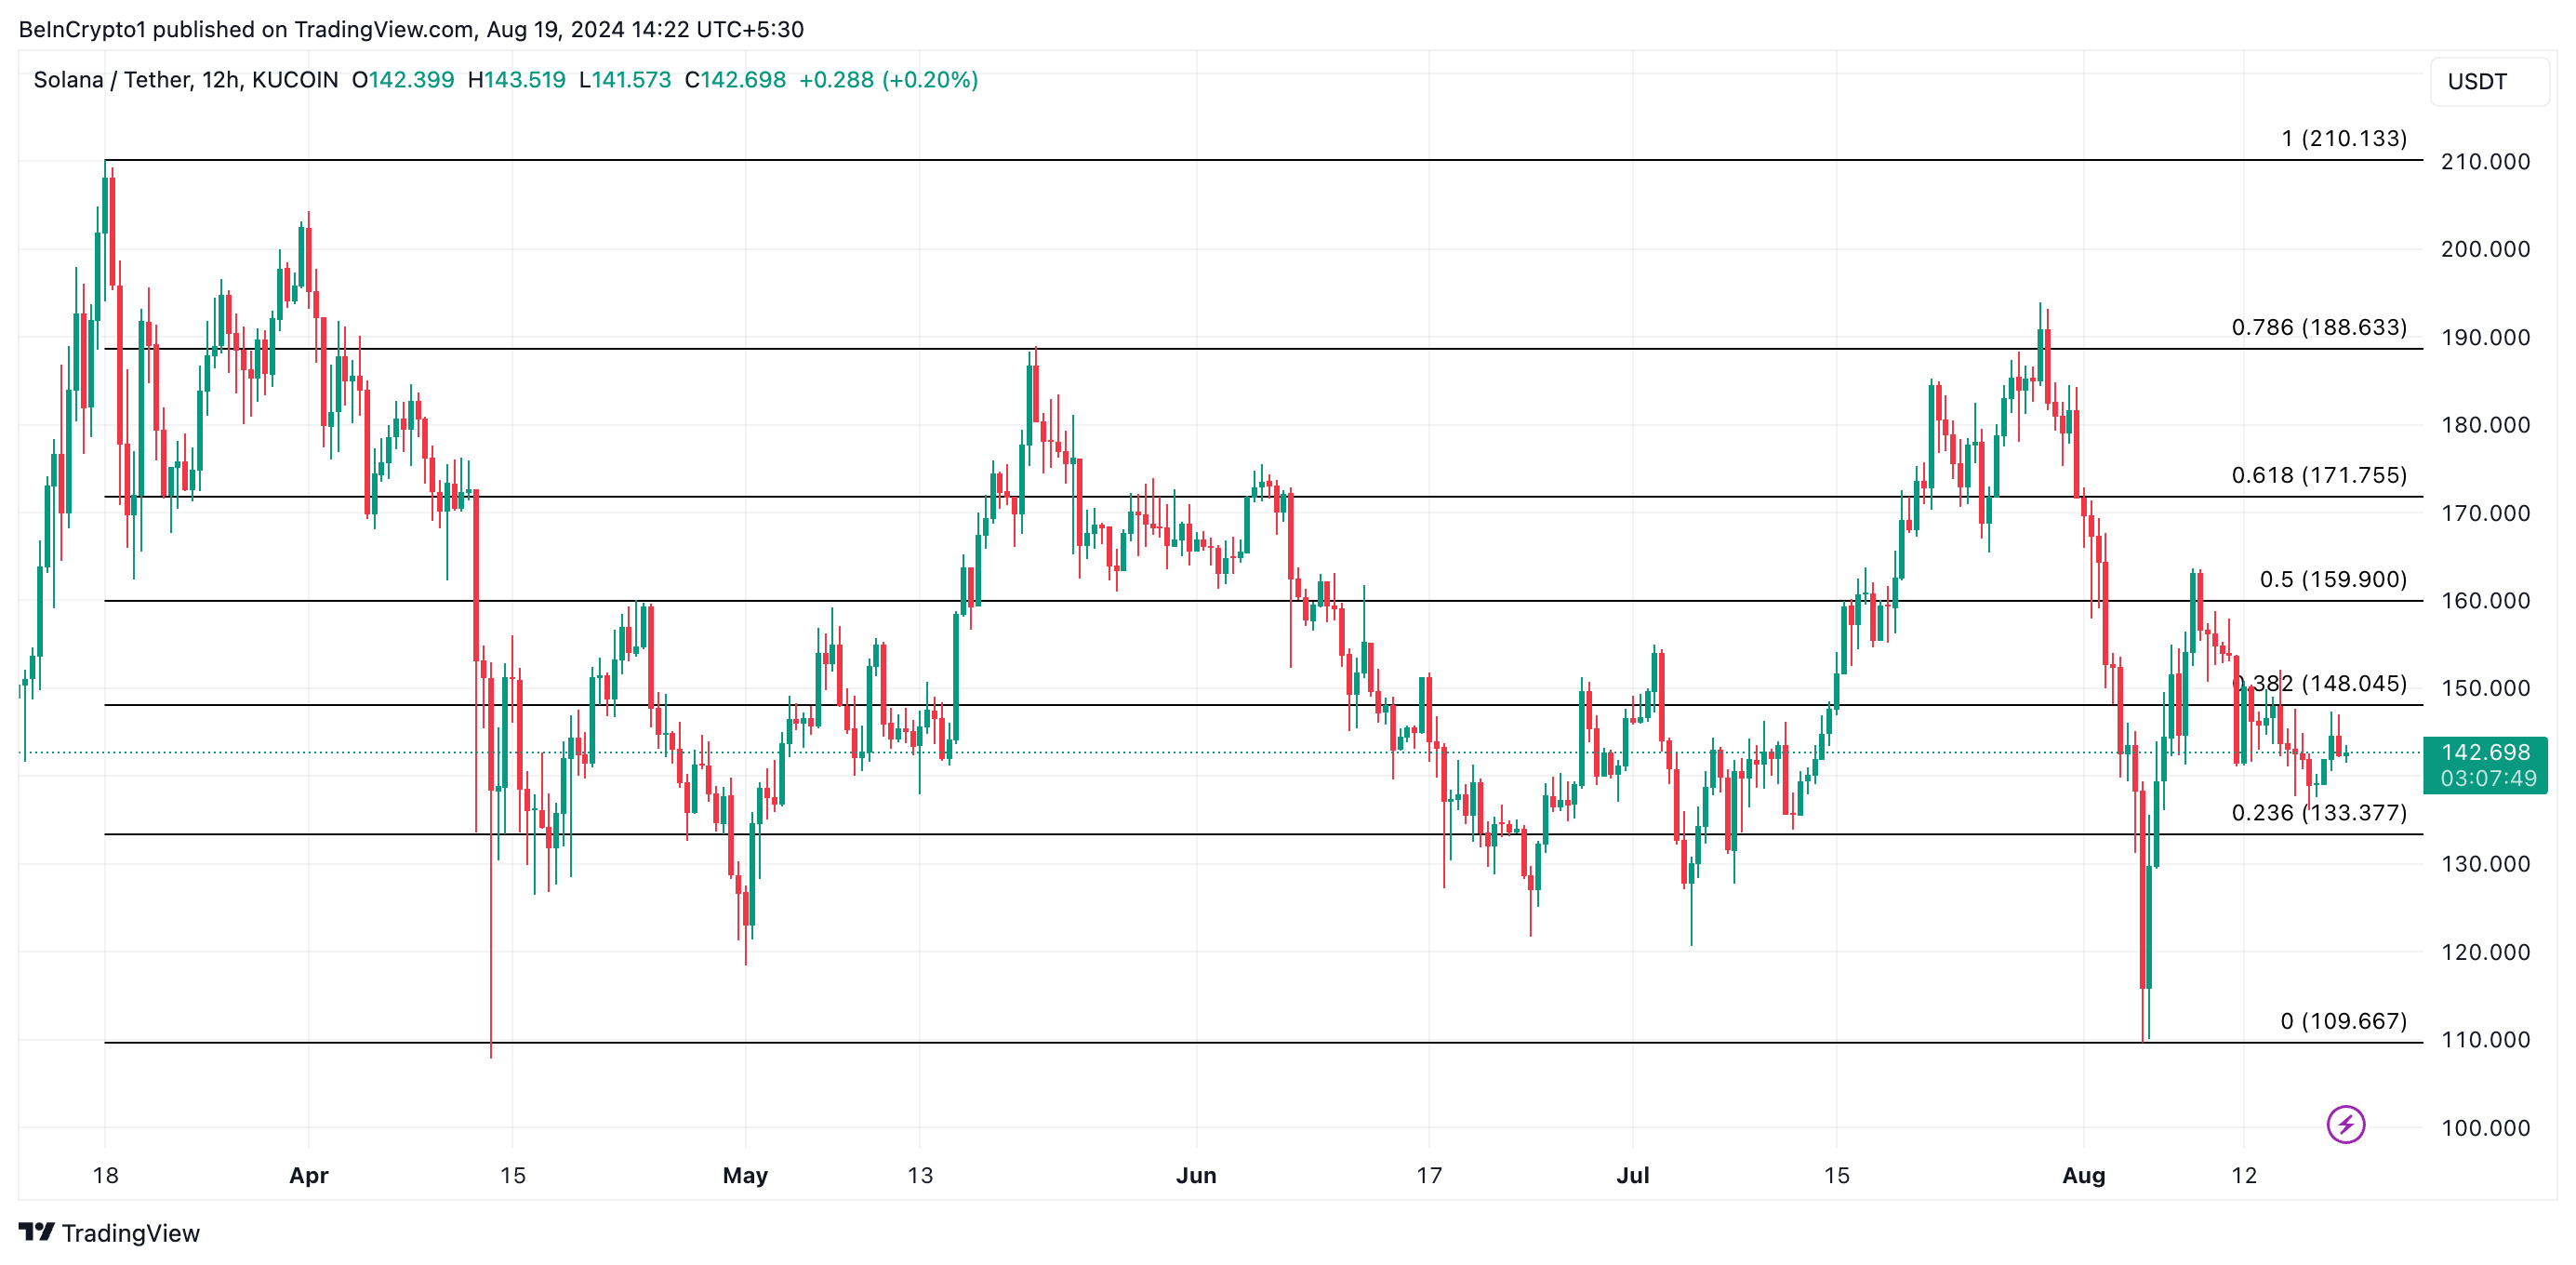
If these short bets hold true, SOL’s value will drop to $133.66. If the bulls fail to defend this support level, its price will plummet further to $109.66, a low it last traded at during the general market downturn on August 5.
Read more: 13 Best Solana (SOL) Wallets To Consider in August 2024
 Solana 12-Hour Analysis. Source: TradingView
However, if SOL witnesses a shift in the market trend from bearish to bullish, its price will reach $148.20.
The post Solana’s (SOL) Emerging Death Cross Means Losses for Traders appeared first on BeInCrypto.
