SOL Potential Breakout Resistance, Ready To Jump Again?

The post SOL Potential Breakout Resistance, Ready To Jump Again? appeared first on Coinpedia Fintech News
Solana (SOL) price today soared above the $157 resistance trendline but ran out of steam with increased selling pressure and now seeking support above it. We may also see a potential retest sitting on the edge which is also a pullback support.
With a sharp increase of 31.78% in 24-hour trading volume, the meme coin favorite coin SOL is now trading at $160.28, at press time. With 5.46% growth in the daytime and, 24% in a month Solana is among the top yearly bullish assets.
This year February SOL succeeded in an attempt to breach the $200 but couldn’t continue the rally as investors decided to book profit.
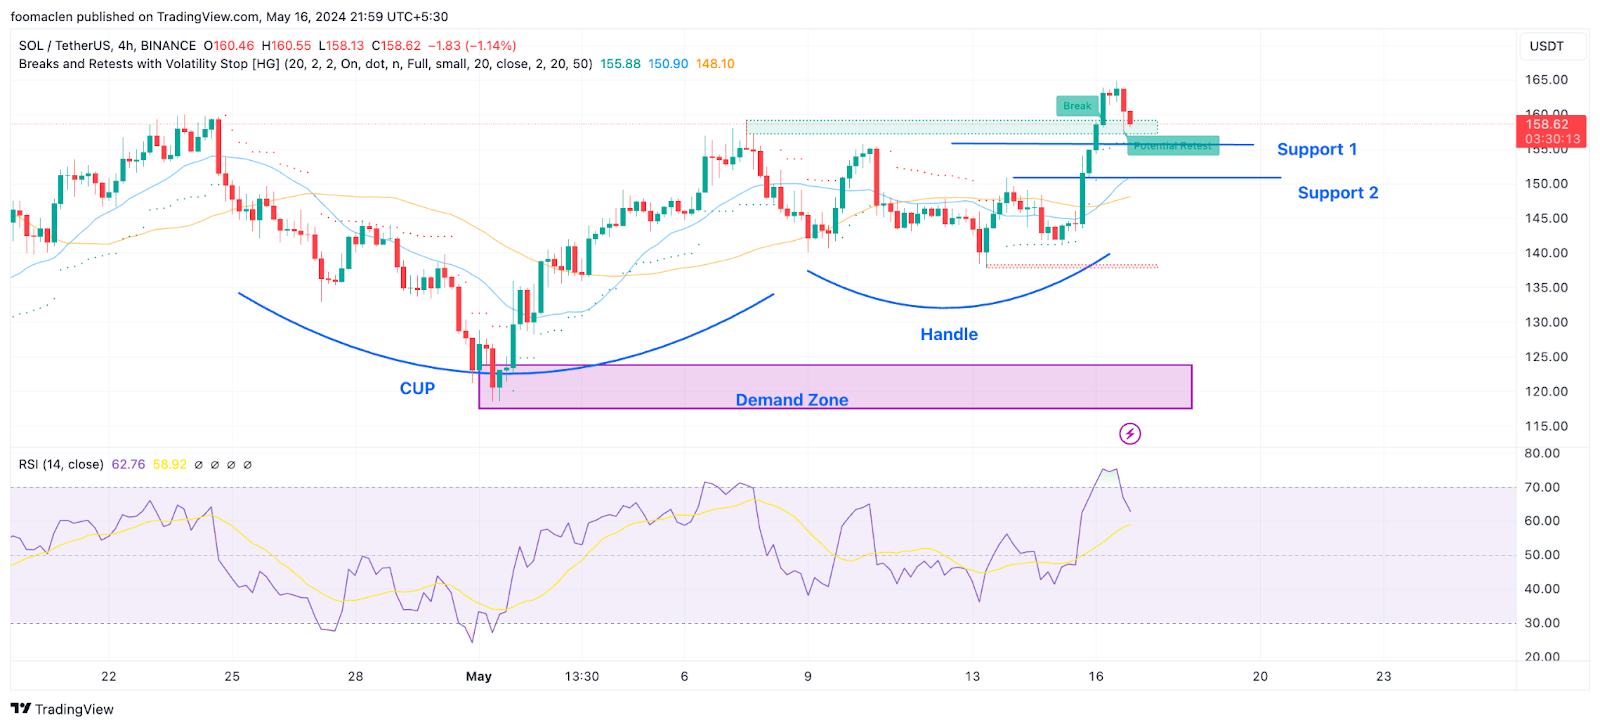
The SOL/USDT 4-hour chart will draw investors’ attention, now trading above the 20-day EMA with a bullish momentum. After a corrective phase, the chart now has a validated Cup and handle pattern. With RSI at 62 heading back to the neutral zone, demonstrating a sideways trend.
While all the technical indicators show a bullish momentum, if there is a pullback, we can rely on the demand zone to provide support. But be cautious in the demand zone, any breakouts from this level may lead to a sharp decline.