Polygon (MATIC) May Witness Further Downside as Demand Declines
Polygon (MATIC) is at risk of extending its losses as demand for the altcoin continues to fall among market participants.
If bearish pressure mounts, MATIC is expected to continue its ongoing downtrend, which might send it below $0.65.
Polygon Battles Low DemandMATIC trades at $0.67 at the time of writing, logging a 13% price decline in the last month. The drop in the price of the altcoin is due to the steady fall in demand in the past few weeks.
Assessed using a 30-day moving average, the count of the daily active addresses that have completed at least one MATIC transaction has trended downward since April 20. As of May 12, this was 356,000, representing a 16% decline in the number of addresses involved in MATIC transactions in the month.
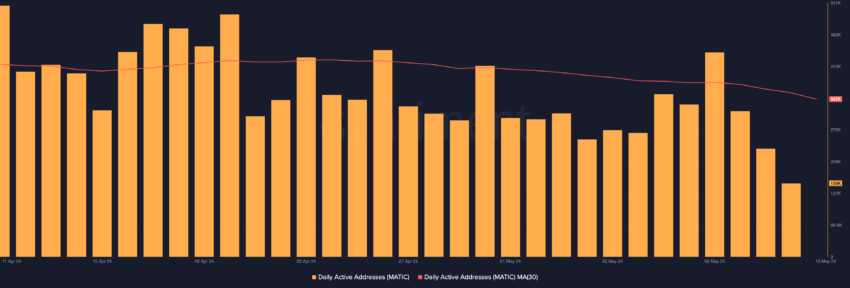 Polygon Daily Active Addresses. Source: Santiment
The period under review has also been marked by a decrease in the demand for MATIC. MATIC’s Network Growth, which tracks the daily number of new addresses created to trade MATIC, has declined since April 20. Between April 20 and May 12, new demand for MATIC dropped by 15%.
Read More: How To Buy Polygon (MATIC) and Everything You Need To Know
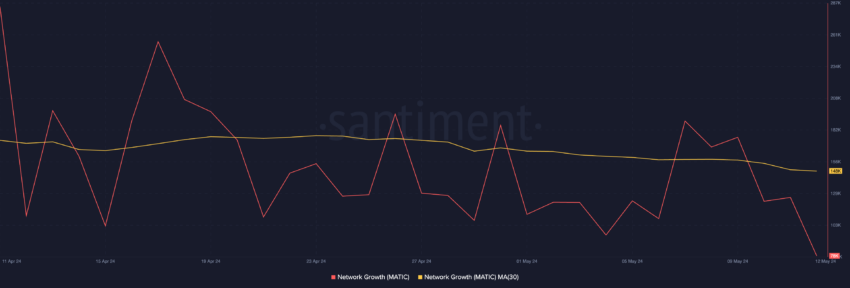 Polygon Network Growth. Source: Santiment
When an asset’s network activity declines in this manner, it means that fewer market participants are buying and selling the asset, resulting in less trading volume. With fewer traders in the market, the market becomes less liquid, putting bearish pressure on the asset’s price.
MATIC Price Prediction: More Losses for Holders?MATIC’s Relative Strength Index (RSI), which sat below the neutral line of 50.0 at the time of writing, signaled that market participants favored token distribution over accumulation.
This indicator is a momentum oscillator that measures the speed and change of price movements. It typically ranges from 0 to 100, with levels above 70 indicating overbought conditions and below 30 signaling oversold conditions.
At 39 and in a downtrend, MATIC’s RSI shows that selling activity outpaced buying activity as demand for the altcoin continues to plummet.
Trading at $0.67, MATIC’s price is above a key support level that has been tested multiple times in the past. With a decline in new demand for the altcoin, it is now vulnerable to losing this support level.
Read More: Polygon (MATIC) Price Prediction 2024/2025/2030
Readings from its Fibonacci retracement show that if the aforementioned bearish sentiments gain momentum, MATIC’s price might end below $0.65. This would result in a potential drawdown to the support at $0.62.
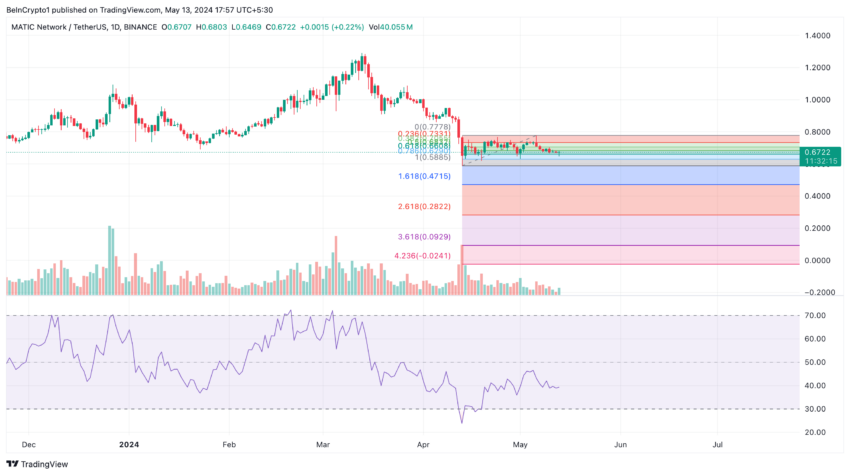 Polygon Price Analysis. Source: Tradingview
However, if market sentiment shifts and buying pressure spikes, it could note a recovery beyond $0.68, thereby invalidating the bearsih thesis.
The post Polygon (MATIC) May Witness Further Downside as Demand Declines appeared first on BeInCrypto.