PEPE Witnesses Decline in Whale Activity as Demand Plummets
In the last month, there has been a significant decline in activity by Pepe (PEPE) whale addresses. On-chain activity reveals a drop in large transactions involving the meme coin completed during the 30-day period.
This has contributed to the double-digit fall in PEPE’s price witnessed in the last week.
Pepe Whales Stay Away From the Meme CoinThe daily count of large PEPE transactions has dropped over the past 30 days. During this period, the number of PEPE transactions valued between $100,000 and $1 million decreased by 50.44%, while transactions valued between $1 million and $10 million saw a decline of 63.46%.
 Pepe Transaction Count. Source: IntoTheBlock
When an asset’s transaction volume declines this way, it indicates a negative shift in market sentiment toward the asset. It often signals a drop in whale interest or confidence in any short-term price growth.
At press time, PEPE trades at $0.00001273. Its value has dropped by 13% in the past seven days. PEPE’s reduced whale activity has manifested in a general decline in demand for the meme coin among market participants.
On-chain data reveals a 12% drop in unique addresses that have completed PEPE transactions since June 6.
Further, new demand for the meme coin has also plummeted. During the period under review, the number of new addresses created to trade PEPE dropped by 17%.
Read More: Pepe: A Comprehensive Guide to What It Is and How It Works
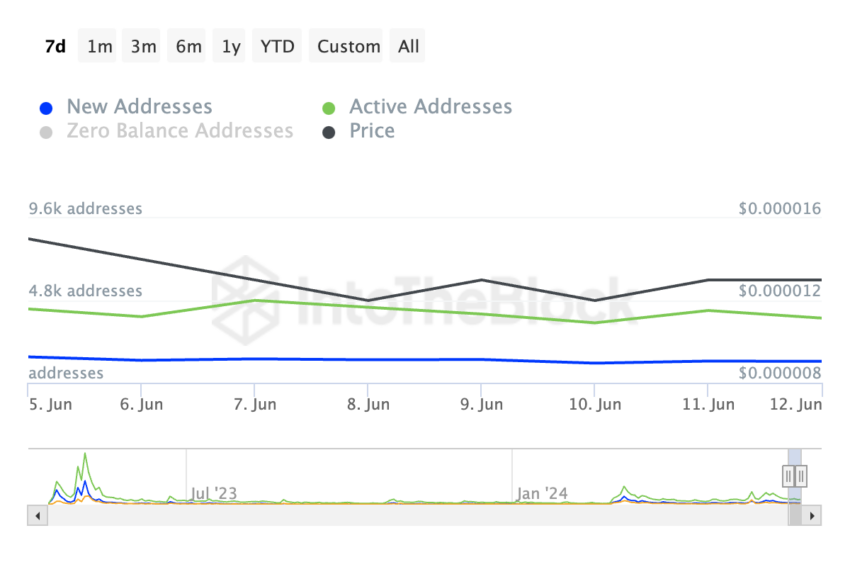 Pepe Network Activity Source: IntoTheBlock
When the demand for an asset declines like this, it confirms the growth in bearish bias toward it.
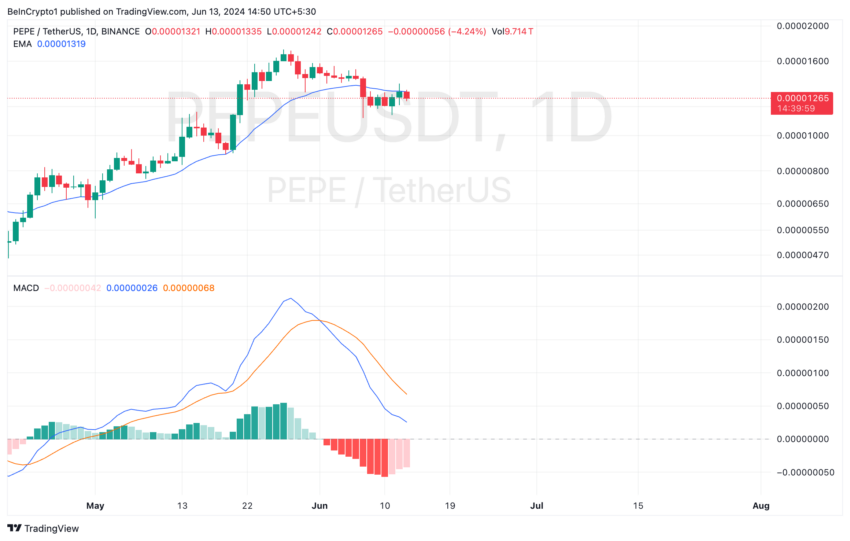
PEPE Price Prediction: Meme Coin Trades Below Key Moving AverageAt its current price, PEPE trades below its 20-day Exponential Moving Average (EMA), which represents an asset’s average price over the past 20 days.
When the price drops under this key moving average, the asset trades lower than its average price in the past 20 days. It is a bearish sign and signals a shift in market trends from buying to selling.
Readings from PEPE’s Moving Average Convergence Divergence (MACD) confirm the shift in sentiment. On June 1, the token’s MACD line (blue) crossed below its signal line (orange) towards the zero line.
 Pepe Analysis. Source: TradingView
This intersection signals that selling pressure outweighs buying activity, and the bears now dominate the market.
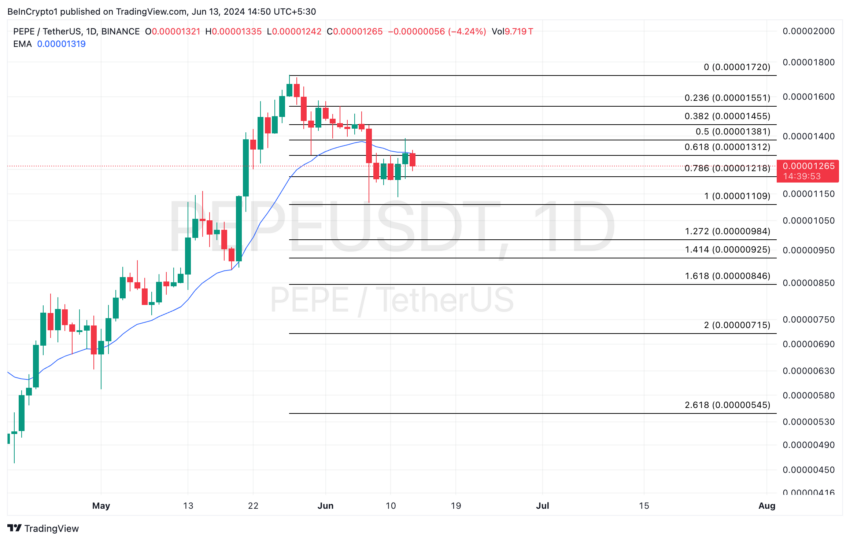
If the bearish influence in the PEPE market continues to surge, it might force its price to $0.000011.
Read More: Pepe (PEPE) Price Prediction 2024/2025/2030
 Pepe Analysis. Source: TradingView
However, if invalidated and the bulls regain market control, PEPE may push higher toward $0.000013.
The post PEPE Witnesses Decline in Whale Activity as Demand Plummets appeared first on BeInCrypto.