NEAR, GRT, And FET Price Alerts Bearish Run This Week?

The post NEAR, GRT, And FET Price Alerts Bearish Run This Week? appeared first on Coinpedia Fintech News
The crypto market has displayed a mixed sentiment over the past weekend with Bitcoin price recording a consolidated weekend. In contrast, the altcoin leader, ETH price, added over 5% to its valuation during this time.
However, AI tokens have displayed a weak price action over the past few days with top Artificial Intelligence cryptos recording significant correction in their respective portfolios. This highlights a constant decline in the hype of these altcoins in the crypto space.
With the halt in the price rally of Artificial Intelligence (AI) category, are top AI tokens on the path of recording a significant correction during the upcoming month?
Dive in as, in this article, we have covered the detailed price analysis and short-term price targets for NEAR, FET, and GRT tokens.
Near Protocol Price Hints A Major Breakdown:Despite increased price volatility in the crypto market, the NEAR price has displayed a weak price action by recording a loss of 3.62% within the past 24 hours and 1.45% over the past seven days, indicating a significant rise in the disinterest of investors in it.
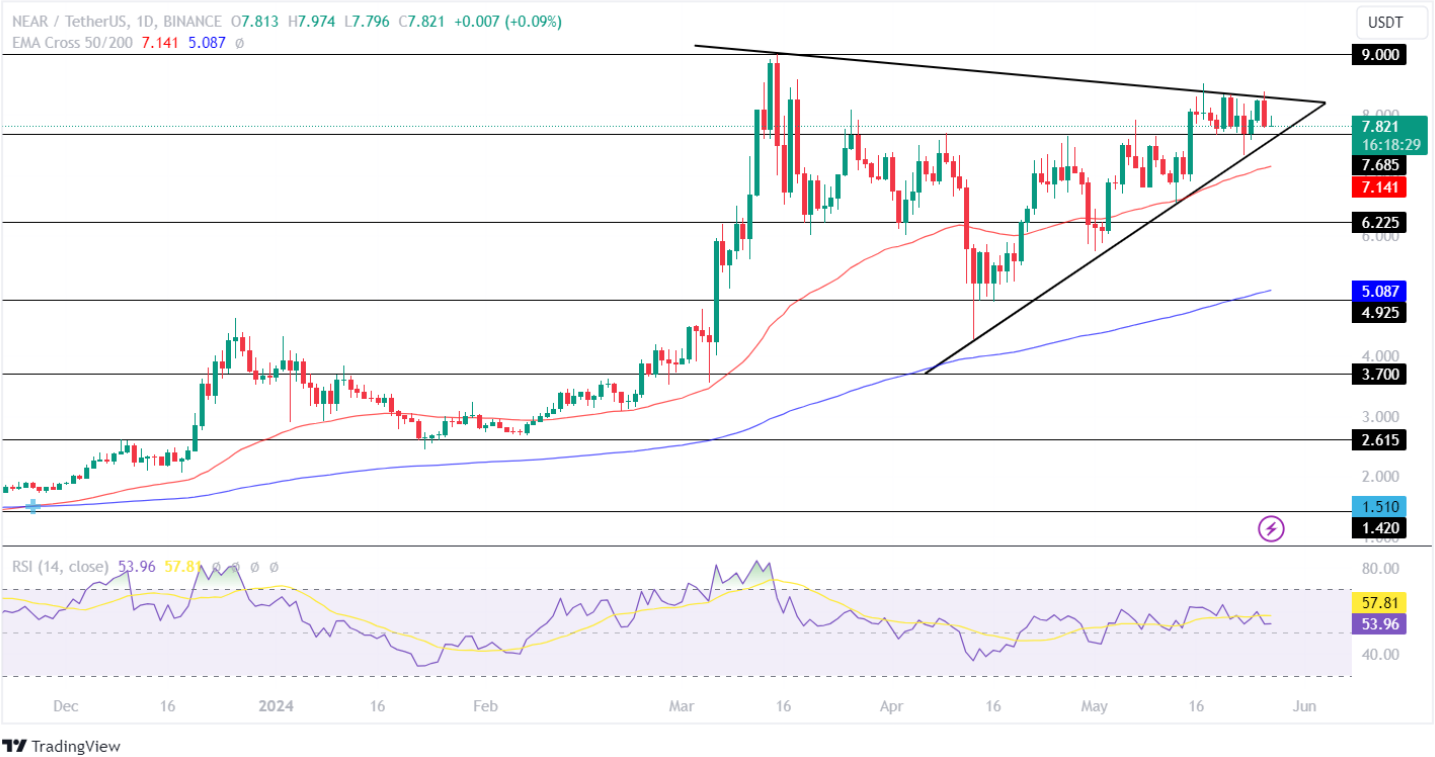 TradingView: NEAR/USDT
Moreover, the Near Protocol price has formed a symmetric triangle pattern in the 1D time frame and is on the verge of breaking it, the outcome of which is uncertain.
The Cross EMA 50/200-day displays a constant uptrend in the price chart, indicating a positive influence on the AI token. However, the RSI records a neutral price action, highlighting a mixed sentiment for the NEAR token in the crypto market.
If the bulls break out of the symmetric triangle pattern, the NEAR price will prepare to test its upper resistance level of $9 in the coming time. Conversely, a breakdown in the chart could result in the price dropping toward its lower support of 6.225 during the upcoming weeks.
Bearish Sentiment Intensifies As GRT Price Displays Negative Price Action:After displaying a bullish price action since the month’s start, The Graph price faced rejection at the resistance level of $0.3550, resulting in it forming a symmetric triangle pattern in the 1D time frame.
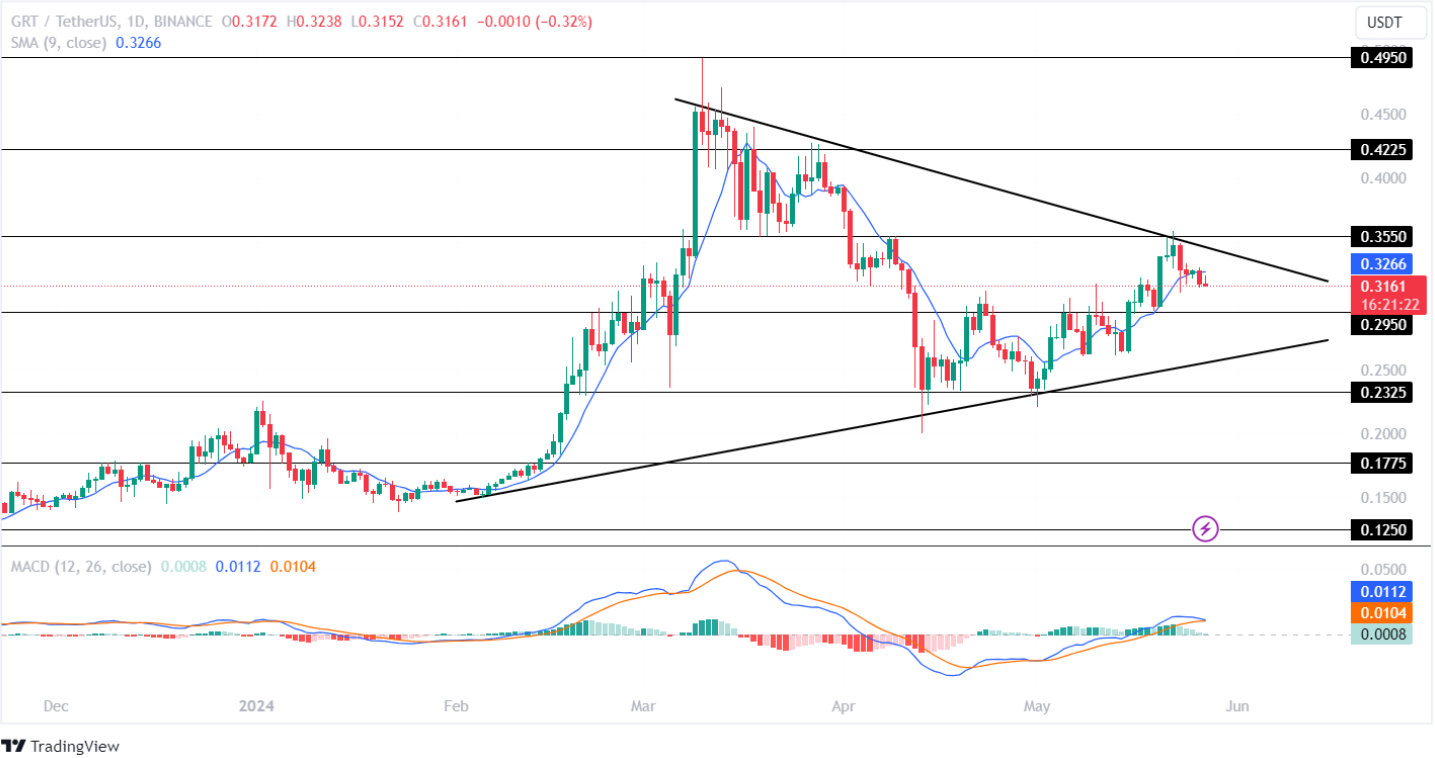 TradingView: GRT/USDT
The SMA displays a negative crossover in the price chart, suggesting a weak price action for the altcoin.
Moreover, the Moving Average Convergence Divergence (MACD) shows a high possibility of a bearish convergence, suggesting the price will continue losing value in the coming time.
If the market regains momentum, the bulls will prepare to break out of its resistance trendline of the triangle pattern. However, if the bears continue to dominate the market, the GRT price will test its support level of $0.2950 this month.
Fetch.AI (FET) Price Forms A Channel Pattern!The FET price continues displaying a weak price action by recording a loss of 1.14% within the past day and 1.02% over the past seven days. Moreover, the Fetch.AI price has recorded gains of less than 5% over the past 30 days, indicating rising disinterest of investors toward AI tokens.
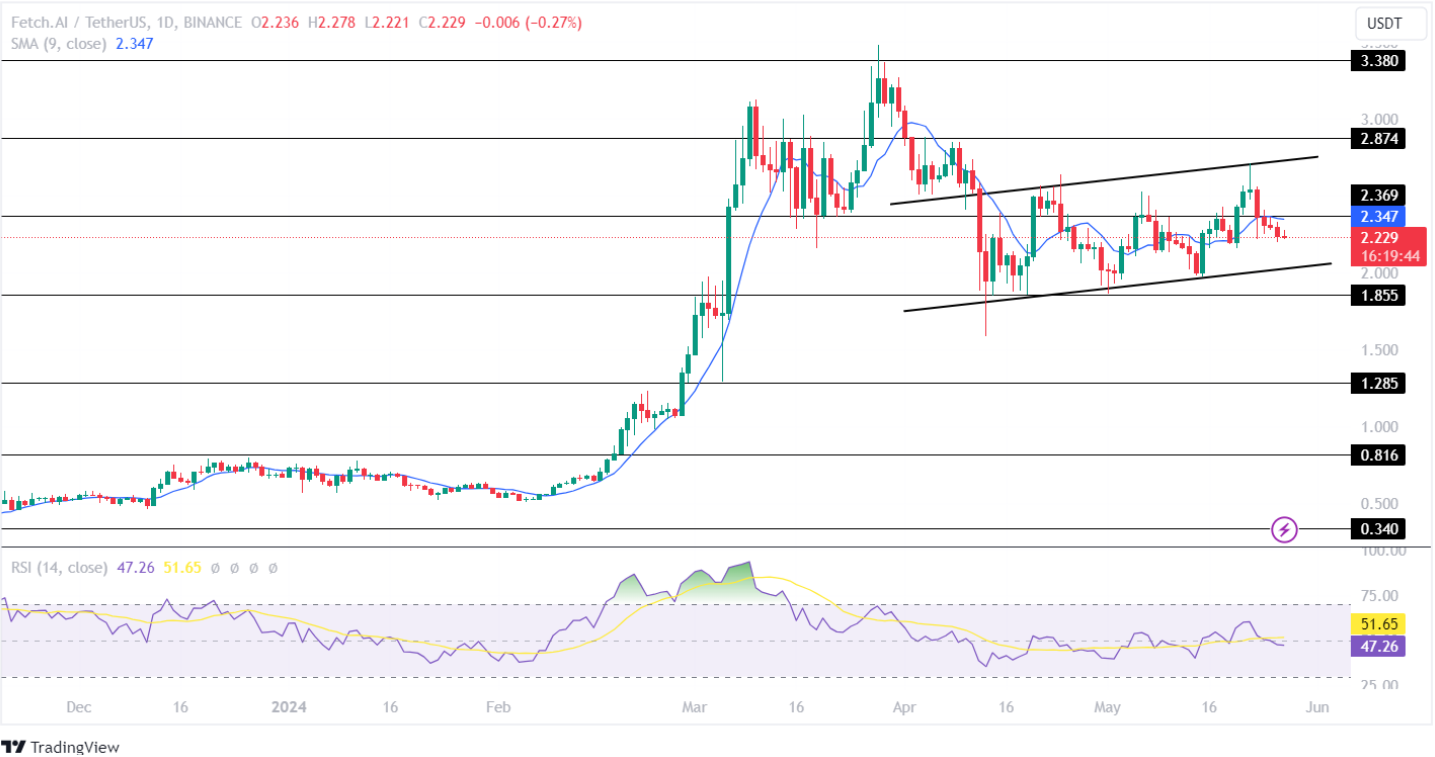 TradingView: FET/USDT
Positively, the FET price has formed a rising channel pattern in its price chart by recording higher highs and higher lows. However, the Simple Moving Average (SMA) displays a bearish curve in the price chart.
Moreover, the Relative Strength Index (RSI) breaks down the mid-point with its average displaying a neutral trend, highlighting uncertainty in future price action for the Fetch.AI token.
If the market pushes the FET price above the resistance level of $2.369, the bulls will prepare to retest its resistance trendline of the channel pattern. Negatively, bearish price action could pull the price toward its support trendline.