How we test internal SSDs at PCWorld
We’ve tested a lot of internal SSDs over the last decade or so, and the improvement to the technology has been astounding. The ongoing advancements in SSDs keep us on our toes and our testing methodology has evolved accordingly. Here’s how it stands at the moment.
What hardware does PCWorld use for testing internal storage?Our current test platform features all of the latest transport technologies: USB 3.2×2 (20Gbps), Thunderbolt 4, PCIe 5.0. There is no discrete USB 4 port, so we test that using the Thunderbolt 4 ports, which do support that protocol.
The operating system is Windows 11 (22H2) 64-bit (updates are disabled) running on an X790 (PCIe 5.0) motherboard/Core i5-12400 CPU combo with two Kingston Fury 32GB DDR5 modules (64GB of memory total). Intel integrated graphics are used rather than a discrete GPU card.
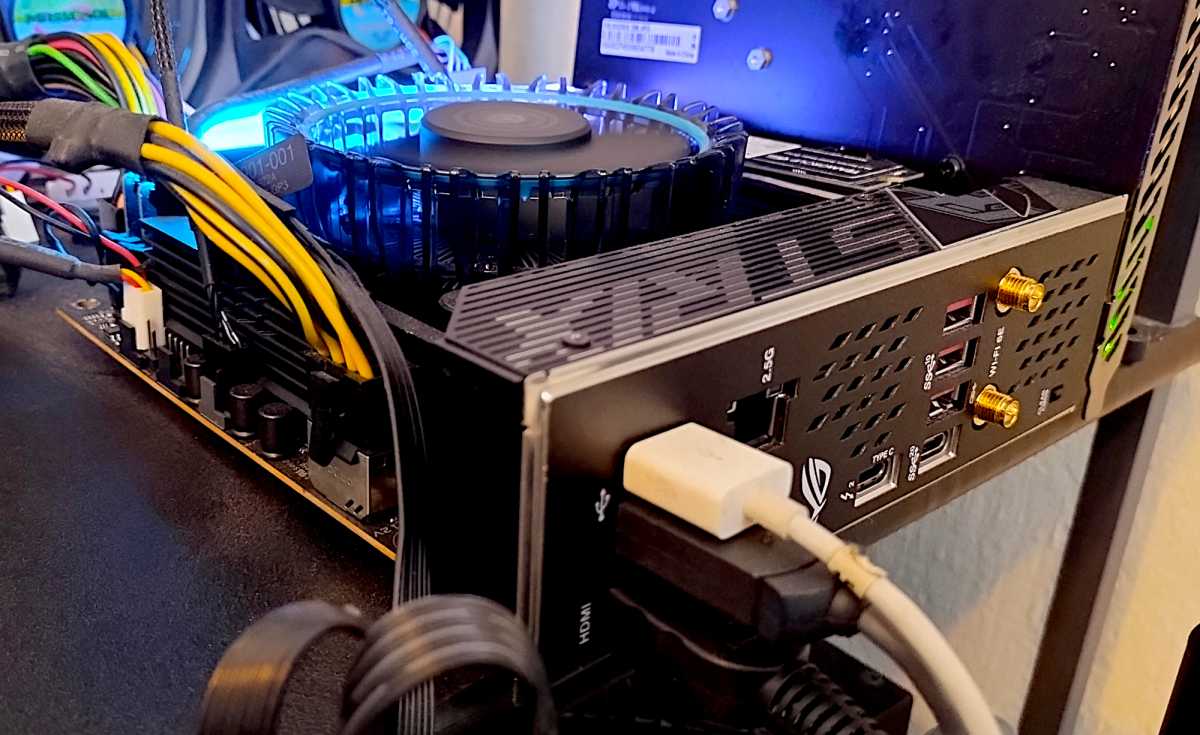 The PCWorld storage test bed. The riser card is a PCIe 5.0 M.2 add-on.
 The PCWorld storage test bed. The riser card is a PCIe 5.0 M.2 add-on.
 The PCWorld storage test bed. The riser card is a PCIe 5.0 M.2 add-on.
An ImDisk RAM disk using 58GB of the 64GB total system memory is used for the 48GB transfer tests and is allotted 58GB of the 64GB total system memory. The operating system runs off of a Samsung 990 Pro 2TB, which is also the source for larger test files.
While we rarely cover internal hard drives these days, when we do, the same basic test methodology is employed.
What tests does PCWorld run on internal SSDs?The synthetic benchmarks we consistently employ are CrystalDiskMark 8 (64GB data set) and AS SSD 2 (10GB data set). These have delivered the most consistent results over the years, plus we have a huge library of results that can be directly compared. However, we will also run ATTO and/or IOmeter to check vendor claims of optimization for certain workloads.
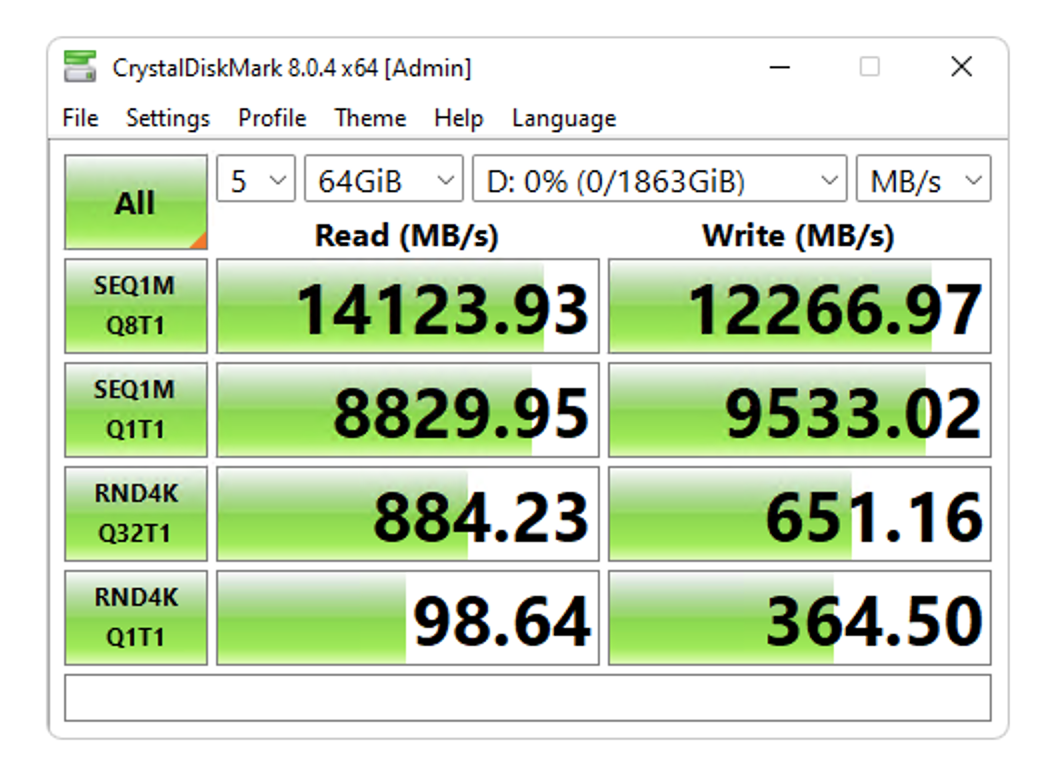 The fastest PCIe 5.0 NVMe SSDs can perform like this on benchmarks, but real-world performance under Window is about a third of this.
The fastest PCIe 5.0 NVMe SSDs can perform like this on benchmarks, but real-world performance under Window is about a third of this.
The fastest PCIe 5.0 NVMe SSDs can perform like this on benchmarks, but real-world performance under Window is about a third of this.
The fastest PCIe 5.0 NVMe SSDs can perform like this on benchmarks, but real-world performance under Window is about a third of this.
The fastest PCIe 5.0 NVMe SSDs can perform like this on benchmarks, but real-world performance under Window is about a third of this.
The issue with synthetic benchmarks is that, as of late, the numbers they spit out far outstrip anything you’ll see in the real world. That’s not to throw shade on these worthy tools; it’s simply that they do their own I/O. In real life you’re stuck with what Windows provides — which is comparatively primitive in not taking advantage of NVMe’s advanced features such as multiple queues.
So, to mirror what users will see in the progress bars while copying data, we transfer a 48GB set of files and folders as well as a single 48GB file to and from the drive we’re testing. The aforementioned RAM disk is employed as the source for writes and the destination for reads to minimize lag impact on the results.
Alas, NVMe SSDs are approaching the point where they’re almost as fast as main memory, so how much longer a RAM disk will be useful is a concern.
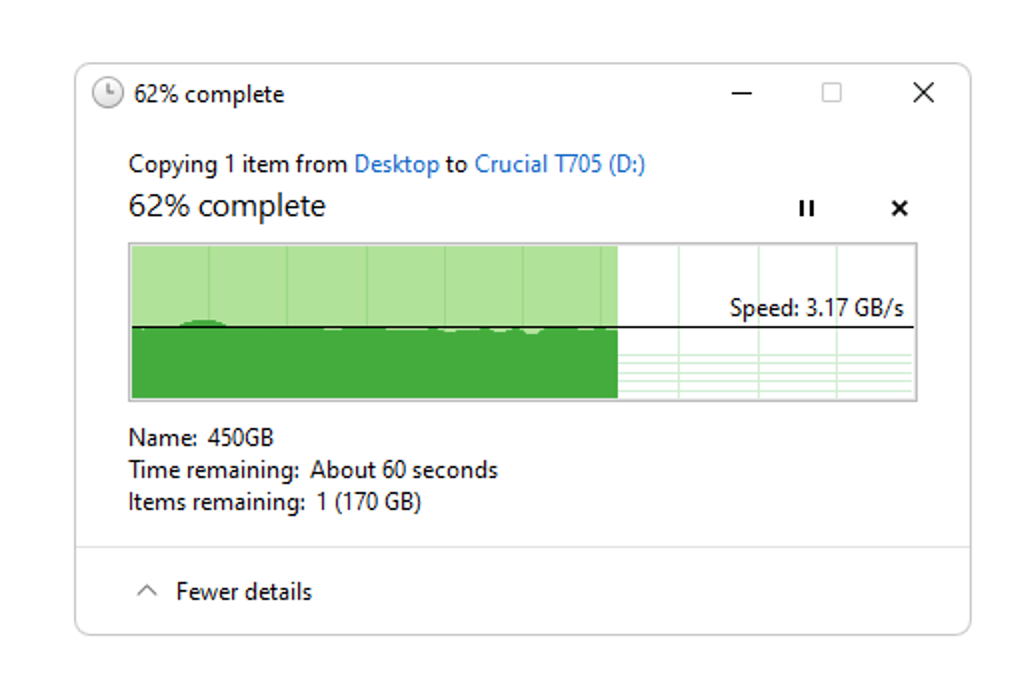
We also write a much larger 450GB file; that’s to see how the SSD behaves when it runs out of cache. That my friends, requires a bit of explaining.
How does SSD technology affect PCWorld’s testing?To comprehend why testing SSDs isn’t as straightforward as kicking the tires of traditional HDDs, tape, optical, etc., you need to understand a bit about the medium.
All SSDs use NAND non-volatile memory to store data. This started as simple on/off SLC (Single-Level Cell) NAND with only one voltage level per cell (charged, not charged). However, to increase storage density, NAND evolved to MLC (Multi-Level Cell/2-bit) with four possible voltage levels, then TLC (Triple-Level Cell/3-bit) with eight possible voltage levels, and now sometimes QLC (Quad-Level Cell/4-bit) with 16 possible voltage levels.
The issue with multiple voltage levels is that it takes far longer to make sure the correct voltage was indeed written. This error checking makes denser NAND slow if you write at its native bit depth.
To circumvent this performance road block, SSD controllers will instead allot (fixed or on the fly) a certain portion of NAND to be written as on/off SLC. The SLC blocks are later rewritten natively to other NAND as MLC/TLC/QLC when the drive has time.
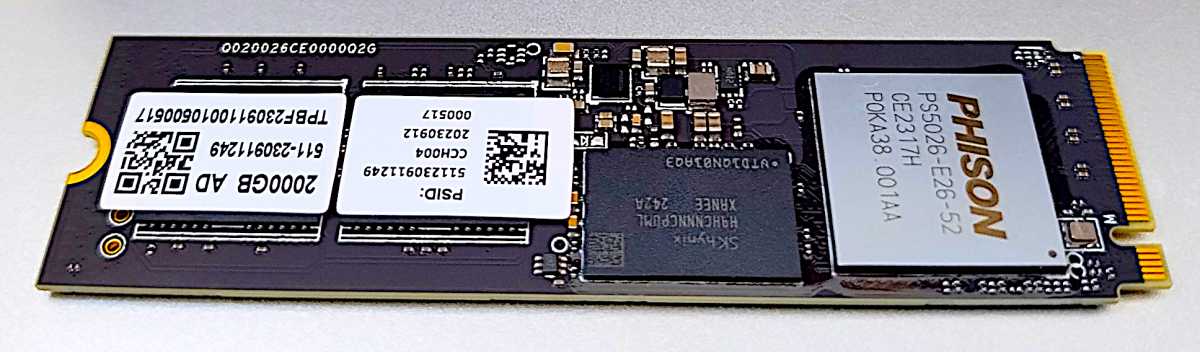 A Phison designed NVMe SSD with both DRAM for caching and NAND.
A Phison designed NVMe SSD with both DRAM for caching and NAND.
A Phison designed NVMe SSD with both DRAM for caching and NAND.
A Phison designed NVMe SSD with both DRAM for caching and NAND.
A Phison designed NVMe SSD with both DRAM for caching and NAND.
How this secondary caching (many drives use DRAM, and more recently system memory, as primary caching) is handled determines how well an SSD will perform under a heavy load.
As mentioned, this is the reason we write a 450GB file to the SSD — to run it out of secondary cache, or see how well it allots more on the fly. If the write rate never drops during the 450GB write, we’ll write another 900GB file immediately after to get to the actual native write rate.
This is somewhat of a tempest in a teapot for the average user who will rarely write enough data to experience the slowdowns we’re talking about. But it is a key differentiator for users who bang hard on their SSDs all day long, such as videographers and the like.
Comparisons and ratingsGenerally, our charts will feature the drive being reviewed, and a few carefully chosen competitors with similar components. However, we do maintain a master spreadsheet with the results of every drive we’ve tested on the current test bed. Our overall rating is derived from a combination of a drive’s placement in the benchmark (CrystalDiskMark and AS SSD) and real-world transfer results, weighted slightly towards the latter.
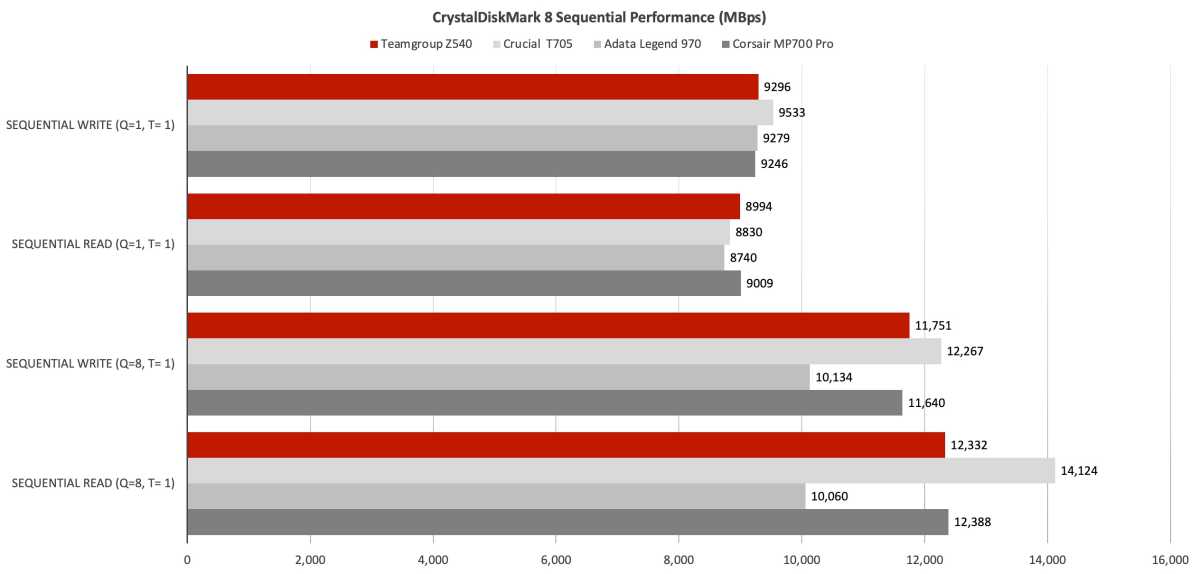 CrystalDiskMark 8 sequential transfer chart showing competing products.
CrystalDiskMark 8 sequential transfer chart showing competing products.
CrystalDiskMark 8 sequential transfer chart showing competing products.
CrystalDiskMark 8 sequential transfer chart showing competing products.
CrystalDiskMark 8 sequential transfer chart showing competing products.
We only publish AS SSD results if there’s an aberration with CrystalDiskMark 8. This is for brevity and consistency so readers can compare results across reviews more quickly and easily.
As we rate on only a 10-point system (half stars up to 5), it’s not always possible to differentiate between a great product and an almost-great product using that alone. Therefore, you should take a look at the actual results charts, and read the review in its entirety before making a buying decision.
Or, you can just look for the Editors’ choice label, which indicates what we’d buy — all things being equal. Often price will be your deciding factor among the SSDs that receive a 4.5 or higher rating.
Computer Storage Devices, Storage