Here’s Why the XRP Price Can Increase by Another 25% in February
The XRP price seemingly broke down from a 440-day ascending support trend line but is reclaiming it this week.
Will XRP reach a weekly close above the level and begin a bullish trend reversal, or will it fail to sustain the rally? Let’s find out!
XRP Reclaims Lost SupportThe weekly time frame technical analysis shows the XRP price had increased alongside an ascending support trend line since November 2022. The upward movement led to a high of $0.94 in July 2023. However, the XRP price has decreased since.
In February 2024, XRP seemingly broke down from its ascending support trend line and a long-term horizontal support area. At the time, the trend line had existed for 440 days.
However, since then, the XRP price movement has been bullish, with the price reclaiming both the trend line and the horizontal area.
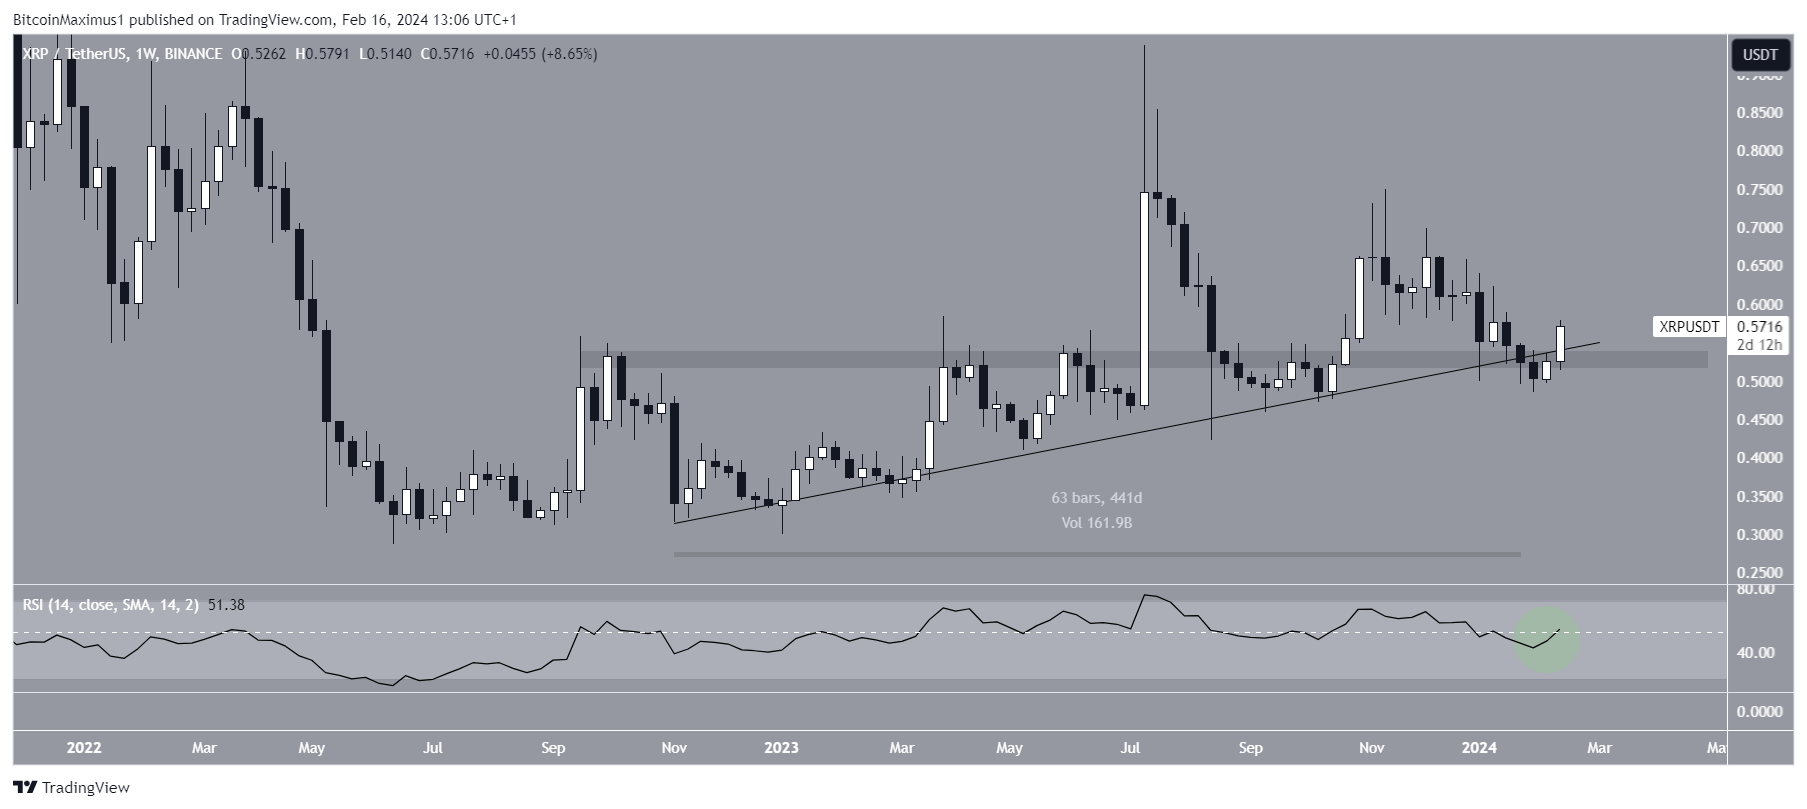 XRP/USDT Weekly Chart. Source: TradingView
The weekly Relative Strength Index (RSI) is also turning bullish. The RSI is a momentum indicator traders use to evaluate whether a market is overbought or oversold and whether to accumulate or sell an asset.
Readings above 50 and an upward trend suggest that bulls still have an advantage, while readings below 50 indicate the opposite. The indicator is increasing and has almost moved above 50 (green circle), both signs of a bullish trend.
Read More: How To Buy XRP and Everything You Need To Know
What Are Analysts Saying?Cryptocurrency traders and analysts on X positively view the future XRP trend for February and beyond.
CaptainFabik noted a potential XRP breakout from a long-term symmetrical triangle.
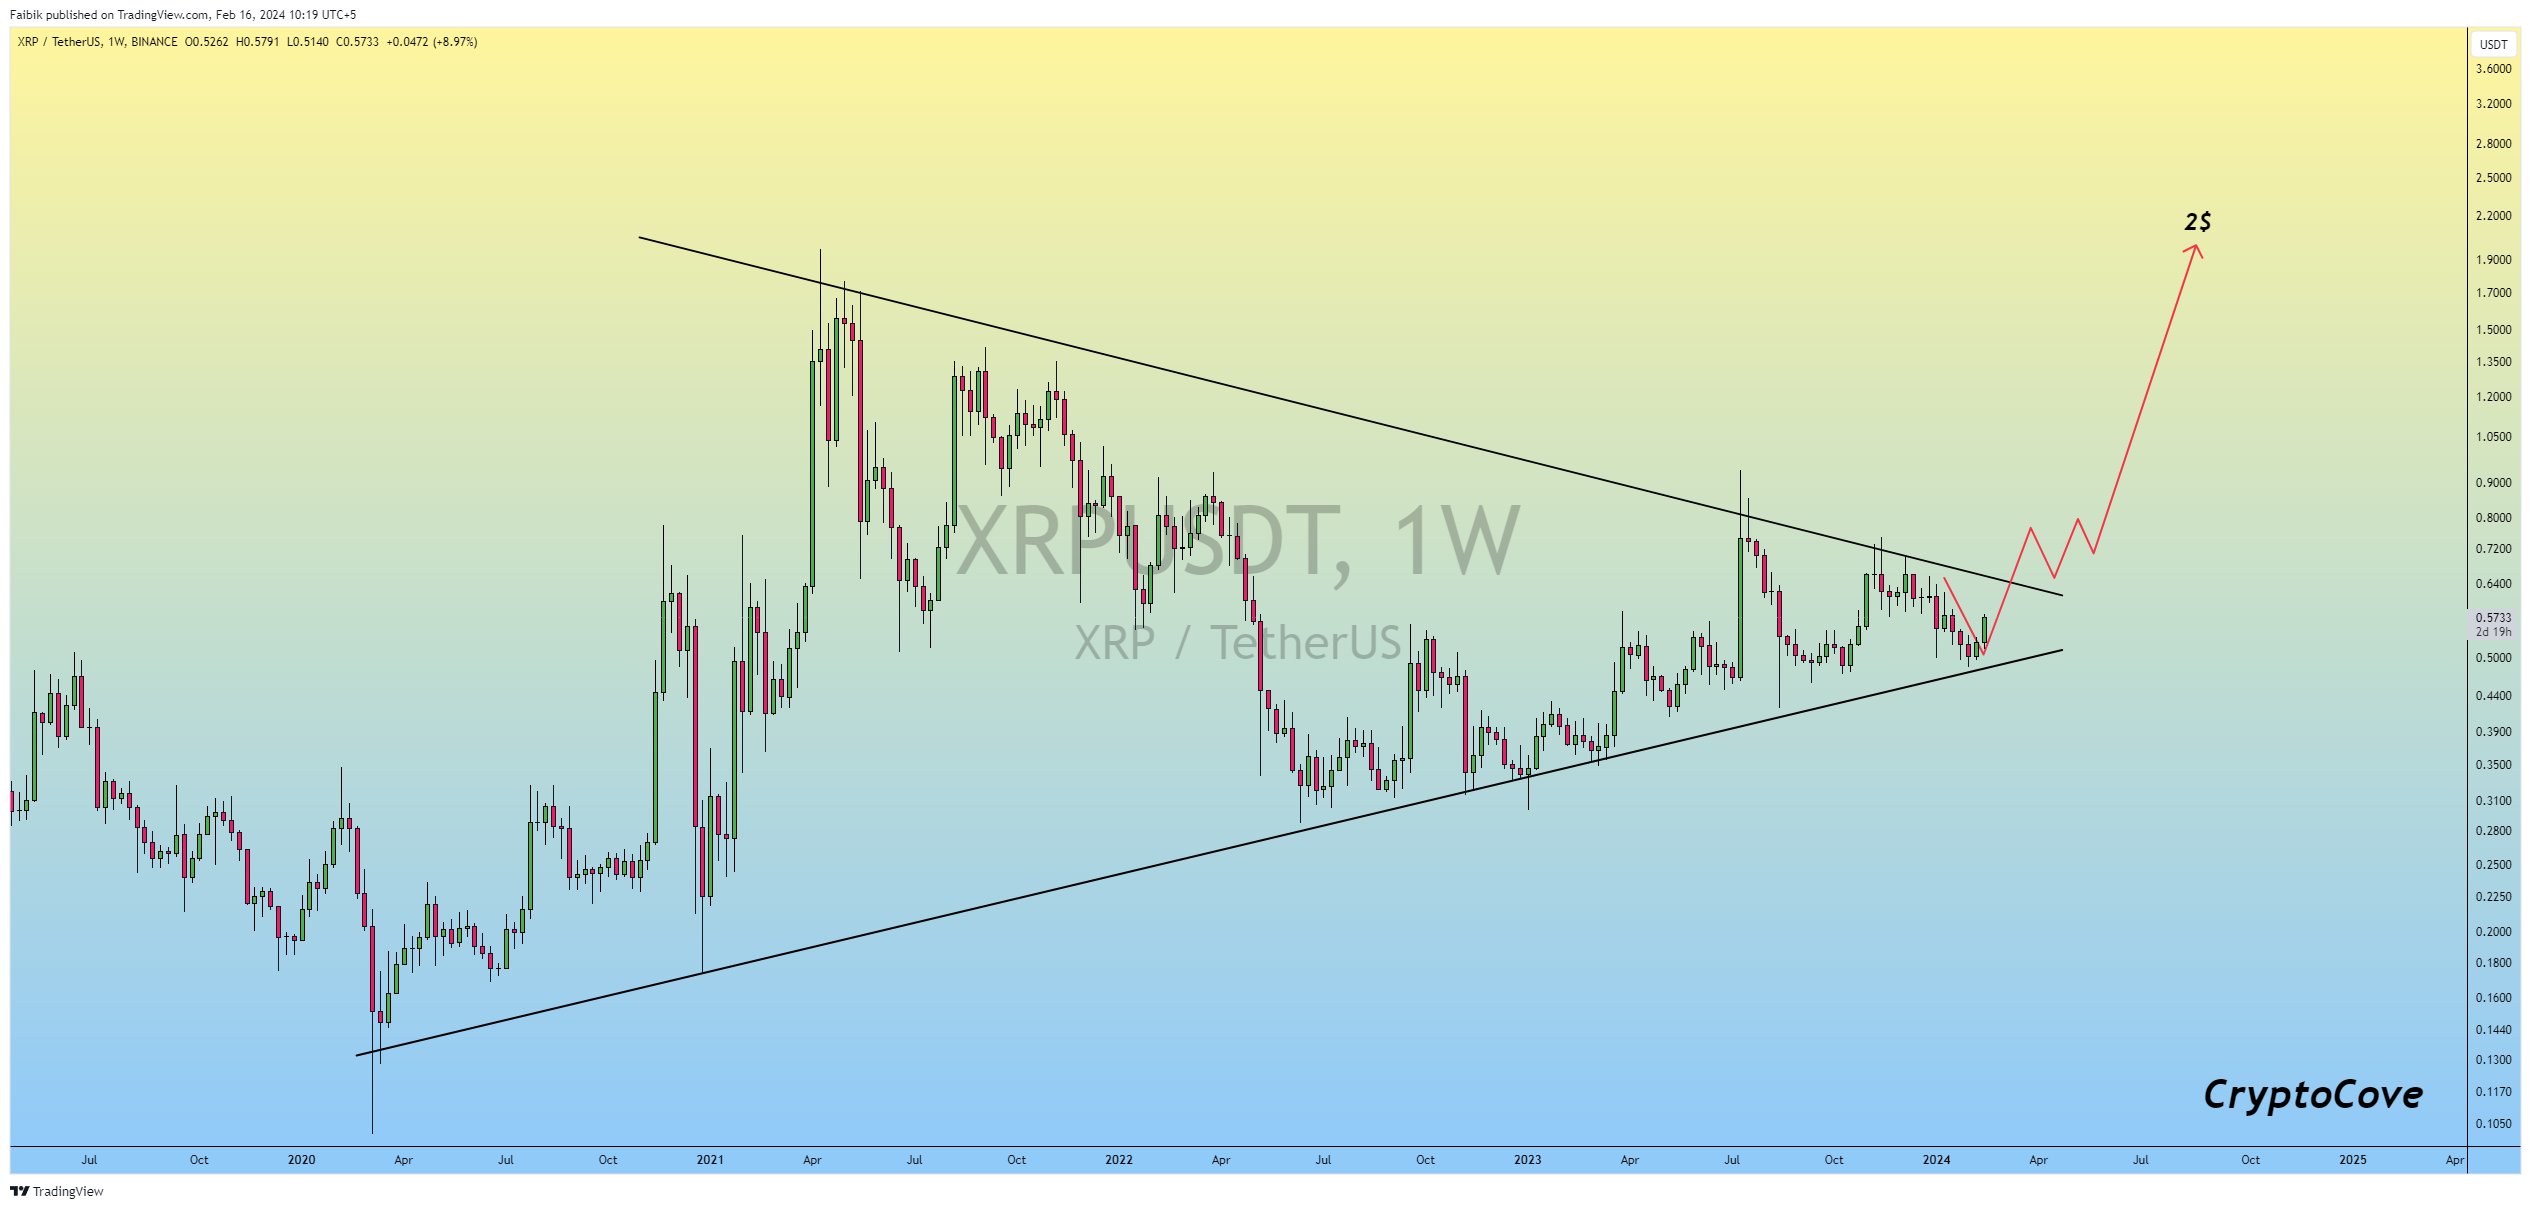 XRP/USDT Weekly Chart. Source: X
Similar thoughts are given by Anup Dhungana, who believes the breakout from the pattern will cause a significant upward movement.
Read More: How to Sell Ripple
XRP Price Prediction: Is the Bullish Reversal in Play?The daily time frame outlook is also bullish, aligning with that of the weekly one. This is because of the price action and RSI readings.
The price action shows that XRP has traded inside a descending parallel channel since November 2023. Such channels usually contain corrective patterns.
The price bounced at the channel’s support trend line on January 23, 2024, and has increased since. Yesterday, it moved above the channel’s midline and the minor $0.55 horizontal resistance area. This aligns with the reclaim in the weekly time frame.
Furthermore, the daily RSI is above 50 and increasing, both signs of a bullish trend.
If XRP breaks out from the channel, it can increase by 25% to the next resistance at $0.70.
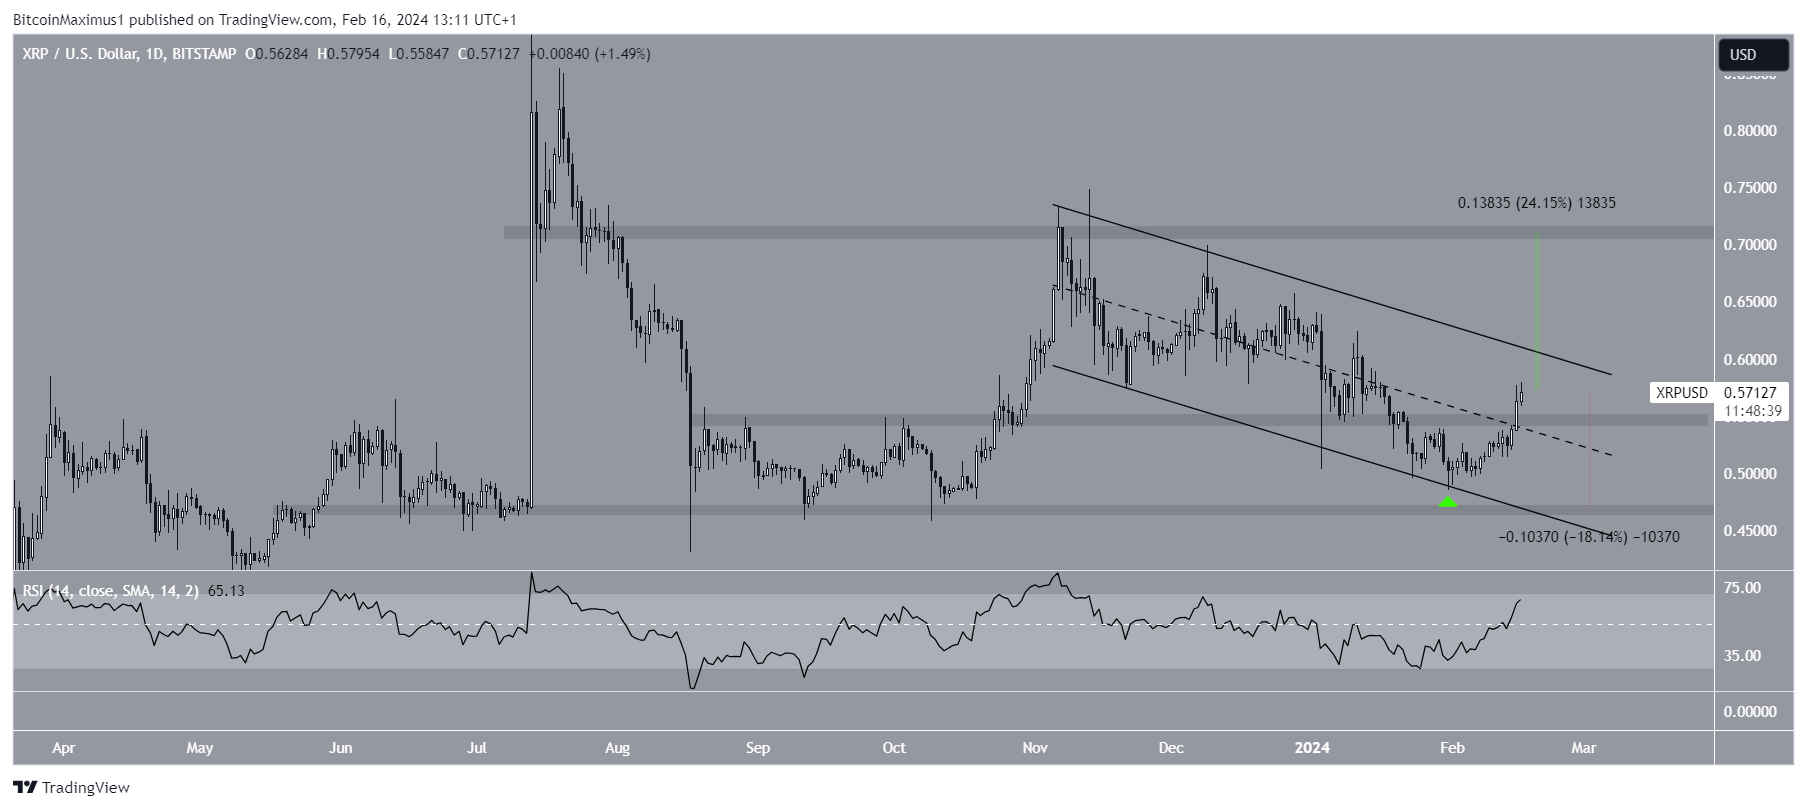 XRP/USD Daily Chart. Source: TradingView
Despite the bullish XRP price prediction, a daily close below the $0.55 horizontal area can trigger an 18% drop to the closest support at $0.47.
For BeInCrypto‘s latest crypto market analysis, click here
Top crypto platforms in the US | February 2024The post Here’s Why the XRP Price Can Increase by Another 25% in February appeared first on BeInCrypto.