Hedera (HBAR) Holds Key Support Levels, Eyes Bullish Breakout
HBAR’s current price action is crucial for traders looking to capitalize on long-term trends. The daily analysis highlights key support and resistance levels that could dictate future movements.
On the daily timeframe, HBAR is above the 200-week EMA. This level now acts as a critical support that the bulls need to maintain to maintain positive momentum.
Hedera Weekly OutlookThe HBAR/USDT pair is navigating a crucial technical landscape. Hedera price action is influenced by key indicators, including the 100-day and 200-day exponential moving averages (EMAs) and significant weekly baseline plateaus.
Long-term support levels include $0.067 and $0.073. These have historically acted as strong supports, preventing further declines.
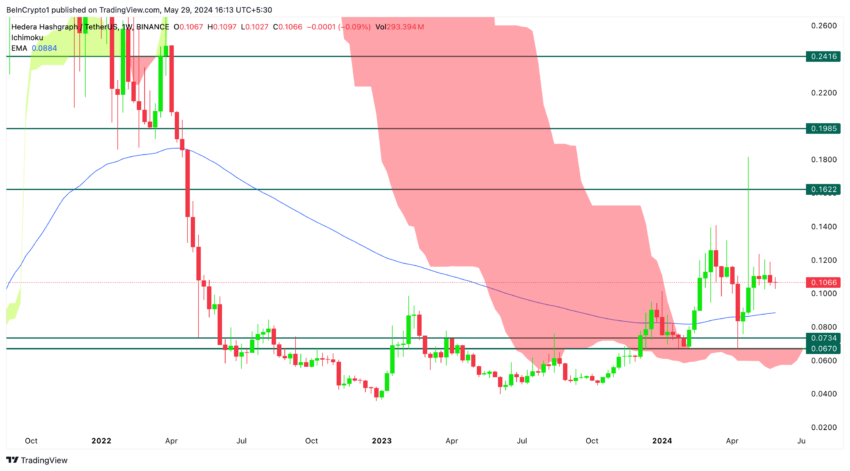 Hedera Price Analysis. Source: TradingView
Long-term resistance levels to watch on a weekly basis are $0.162, which represents a significant barrier to a major potential price breakout, $0.198, which indicates a possible price ceiling, and $0.241, which represents a major hurdle to upward movement.
Read More: What Are Tokenized Real-World Assets (RWA)?
These levels are more important than those on the daily chart due to their long-term implications, providing more reliable signals for traders and investors.
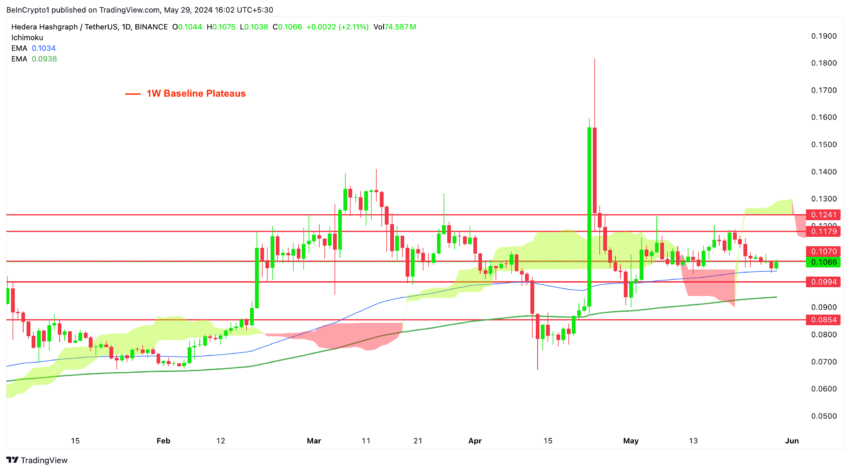
Hedera Daily OutlookThe price is above the 200-day EMA on the daily timeframe, indicating a bullish sentiment in the long-term trend. This level now acts as a critical support that the bulls need to maintain to maintain positive momentum.
The price also trades slightly above the 100-day EMA, suggesting medium-term support. However, the close proximity to this EMA indicates potential volatility and underscores the importance of maintaining this level to avoid further downside risk.
 Hedera Price Analysis. Source: TradingView
Weekly Baseline Plateaus
Hedera Price Analysis. Source: TradingView
Weekly Baseline Plateaus
These lines represent pivotal support and resistance levels derived from the weekly Ichimoku baselines (in red), which are crucial in dictating price movements.
Mid-Term Resistance and Support Levels for HBAR/USDTThe key resistance levels for the HBAR/USDT pair are $0.124, $0.118, and $0.107. These levels represent significant barriers where the price may encounter selling pressure. On the support side, the critical levels to watch are $0.099, $0.090, and $0.085.
These levels are essential as they indicate where the price may find buying interest and potentially rebound.
The Ichimoku Cloud serves as an indicator of future support and resistance zones. The current price position below the cloud suggests a neutral to slightly bearish sentiment.
The cloud is transitioning from red to green, indicating potential bullish momentum if the price can break above and sustain levels within the cloud.
The HBAR price is currently at $0.106, positioned between resistance at $0.107 and support at $0.099. This tight range suggests a consolidation phase in which the market awaits a decisive breakout or breakdown.
Read More: Hedera (HBAR) Price Prediction 2024/2025/2030
The close proximity to both the 100-day and 200-day EMAs highlights the critical nature of this range. A breakout above $0.1070 could target higher resistance levels at $0.118 and $0.1241, while a breakdown below $0.0994 could lead to a test of lower support levels at $0.0900 and $0.0854.
Strategic Recommendations Bearish to Neutral OutlookThe current outlook for Hedera is bearish to neutral in the mid-term. If the price tests the daily Ichimoku cloud on the upside, this could trigger a change in market sentiment, shifting from bearish to bullish and potentially reaching the critical resistance of $0.162.
Traders should closely monitor the price action around the key support and resistance levels and be prepared for potential volatility.
The post Hedera (HBAR) Holds Key Support Levels, Eyes Bullish Breakout appeared first on BeInCrypto.