FLOKI Price Could Face Correction After Hitting All-Time High
Floki’s recent surge to an all-time high has certainly turned heads, riding a strong upward trend. Much credit for this momentum goes to Bitcoin’s own recovery journey from its $56,000 price level, inching closer to its record high of $73,000.
Floki, known for its wild swings and meme status, has been in the spotlight.
More Upside for Floki?The market capitalization is hovering around $3.1 billion. Given its significance as an important psychological threshold, the next resistance zone could potentially be at $4 billion.
Interestingly, amidst this surge, the price has found considerable support at key exponential moving averages, particularly in the 1-hour and 4-hour timeframes. This underscores the resilience of Floki’s upward trajectory.
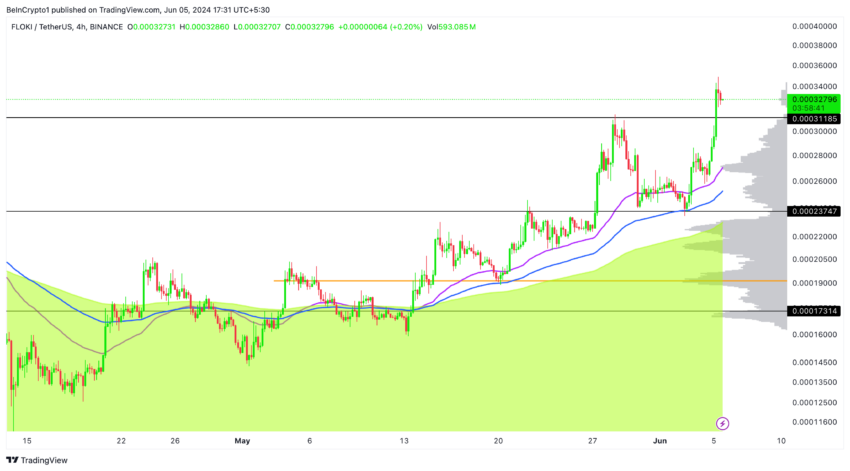 Floki’s 4-Hour Price Analysis: TradingView
During the uptrend, the EMA 50 and 100 played crucial roles as support levels. These levels play a crucial role as support and resistance points.
The volume profile highlights significant support and resistance ranges, with the 4-hour profile currently indicating a weak resistance zone at current prices. A potential correction might bring the price back to around $0.00028 before resuming its upward trend towards new all-time highs.
Read More: What Are Meme Coins?
Observing the volume profile, it becomes evident that our present prices are associated with a notably weak resistance zone. This suggests the market has struggled to maintain higher prices in this area, indicating a potential barrier to upward movement.
Considering this, it’s reasonable to anticipate a corrective movement in the price. A likely target for this correction could be around the $0.00028 level. This would allow the market to readjust before potentially resuming its upward trajectory.
It’s important to note that corrections are a natural part of market movements and often serve to establish healthier price dynamics. Therefore, a pullback to the $0.00028 level shouldn’t necessarily be interpreted as a negative development. Instead, it could pave the way for a more sustainable uptrend, potentially leading to new all-time highs in the future.
Floki’s 1-Hour Price MovementWhen zooming in on the 1-hour timeframe, we notice consistent trends: FLOKI trades above the 50, 100, and 200 exponential moving averages, suggesting robust price action in the short to mid-term.
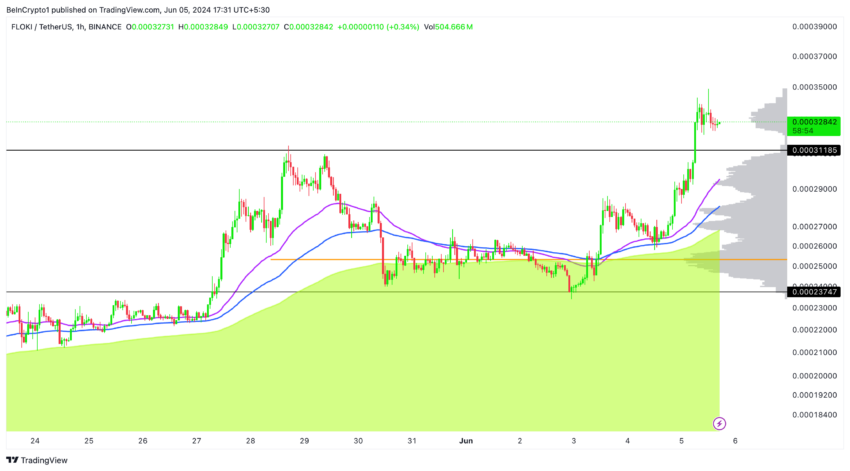 Floki’s 1-Hour Price Analysis: TradingView
The 50 EMA currently fluctuates around $0.00029, showing a steady uptrend. However, if this line levels off, it might indicate that the price is gearing up for a short to mid-term correction.
It’s crucial to monitor the upcoming price range, particularly at $0.00028, as it could serve as a critical support level, as indicated by the volume profile depicted in gray, highlighting significant trading activity within this price range.
The volume profile indicator is a tool used in technical analysis to analyze the trading activity of a financial instrument over a specified period. It is typically depicted as a histogram on the price axis. It displays the volume traded at each price level over the specified period, providing insights into where most trading activity occurred.
The volume profile indicator helps traders identify significant support and resistance levels. As well as areas of high trading activity, which can indicate areas of interest for buyers and sellers.
Read More: 7 Hot Meme Coins and Altcoins that are Trending in 2024
By analyzing the volume profile, traders can better understand market dynamics. Including potential supply and demand zones, price acceptance or rejection levels, and the overall strength of price movements.
Strategic Recommendations:Given the analysis of Floki’s recent price movements and market dynamics, there are several strategic recommendations to consider:
Stay Alert: Monitor key price levels, especially around $0.00028, which the volume profile suggests could be a significant support level. Monitoring these levels can provide valuable insights into potential market reversals or continuations.
Manage Risk: As corrections are a natural part of market cycles, it’s essential to implement effective risk management strategies. Consider setting stop-loss orders and diversifying your investment portfolio to mitigate potential losses during market downturns.
Plan for Opportunities: A corrective movement towards $0.00028 could present buying opportunities for investors looking to enter or add to their positions in Floki. Having a predefined plan and being prepared to take advantage of market movements can help capitalize on potential price fluctuations.
The post FLOKI Price Could Face Correction After Hitting All-Time High appeared first on BeInCrypto.