Ethereum Sets Sights on $2,800 Recovery After Momentum Builds Post-Dip
Some days ago, Ethereum (ETH) showed readiness to climb toward $3,000. But as last month neared its end, the momentum changed, leading the second most valuable cryptocurrency to drop below $2,600.
Will ETH’s price recover? This is one thing that investors will want to know. In this on-chain analysis, BeInCrypto explains why the altcoin might soon reverse the trend.
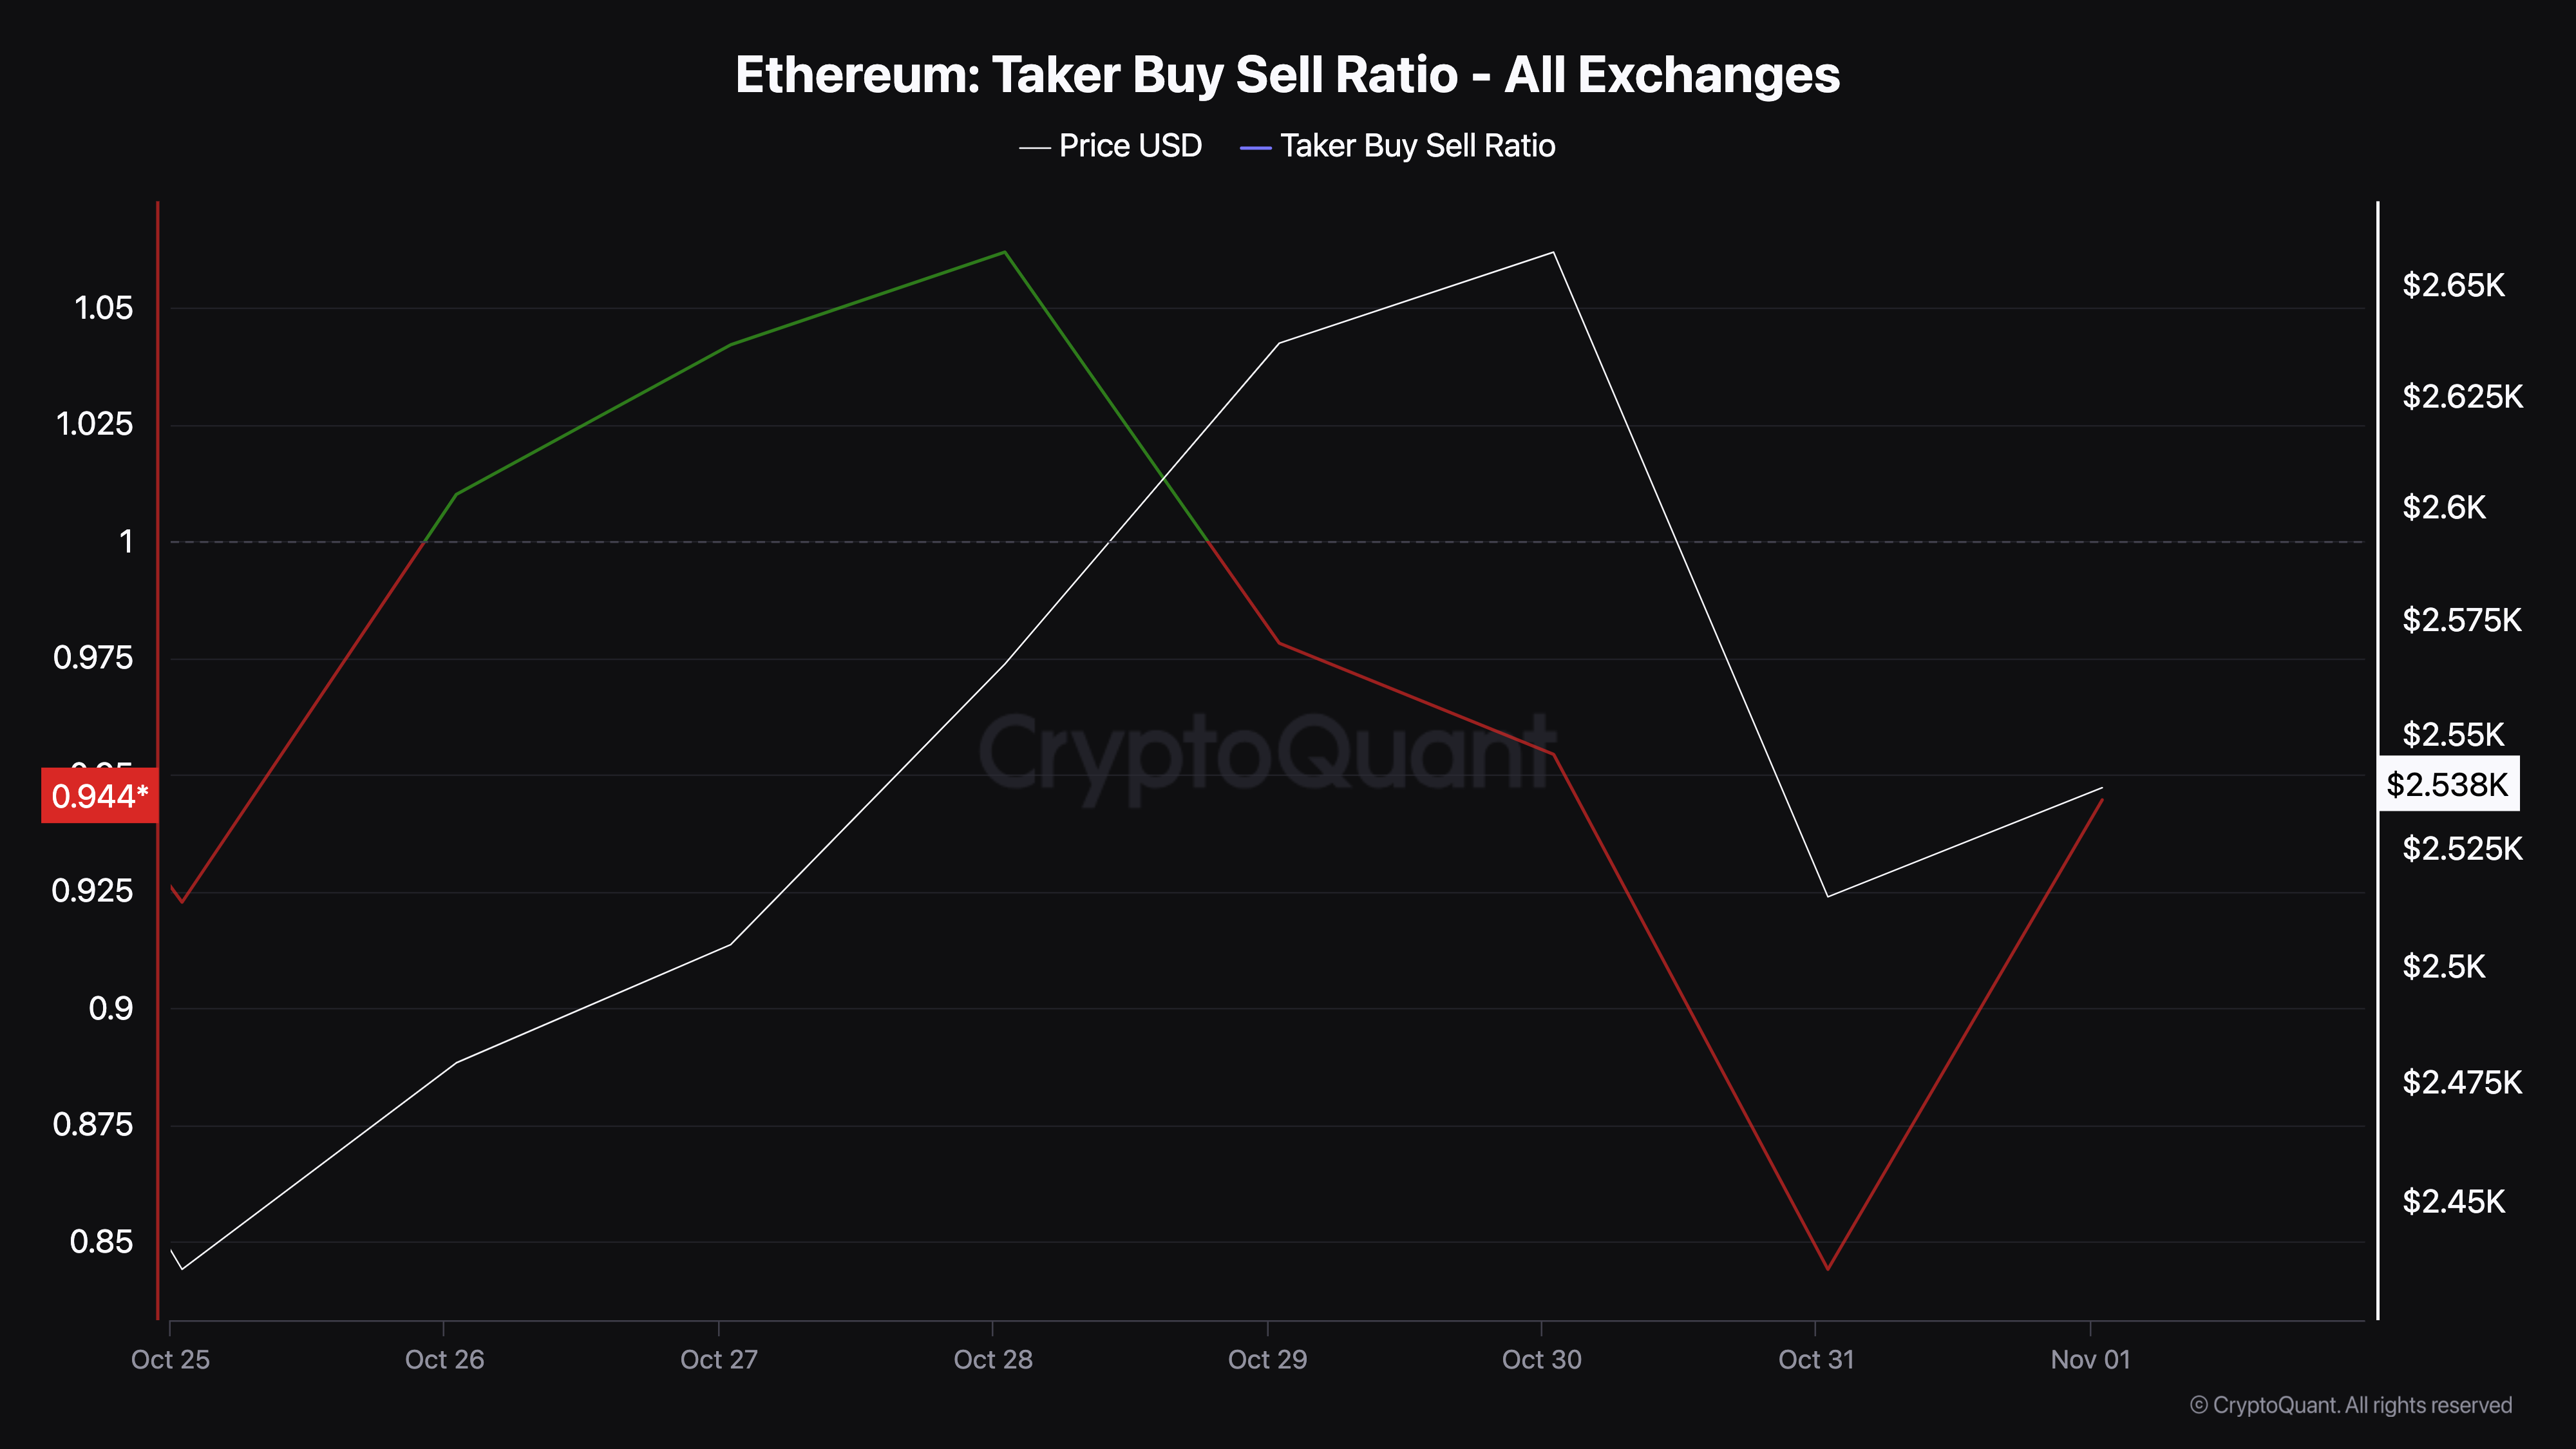
Ethereum Bearish Outlook EasesAccording to CryptoQuant, Ethereum’s price decrease caused a decline in the Taker Buy/Sell Ratio. This ratio is calculated as the buy volume divided by the sell volume in perpetual swap trades.
When the value is above 1, it means the trend is bullish. However, a value below 1 means that the trend is bearish. On October 31, Ethereum’s Taker Buy/Sell Ratio was 0.84, meaning that the sentiment was bearish at that time.
But as of this writing, the reading has increased and is on the verge of hitting a rating of 1. Should the indicator’s rating continue to climb, then ETH’s price might also follow in the same direction, suggesting that it could get close to $2,800 as it was some days back.
Read more: Ethereum ETF Explained: What It Is and How It Works
 Ethereum Taker Buy/Sell Ratio. Source: CryptoQuant
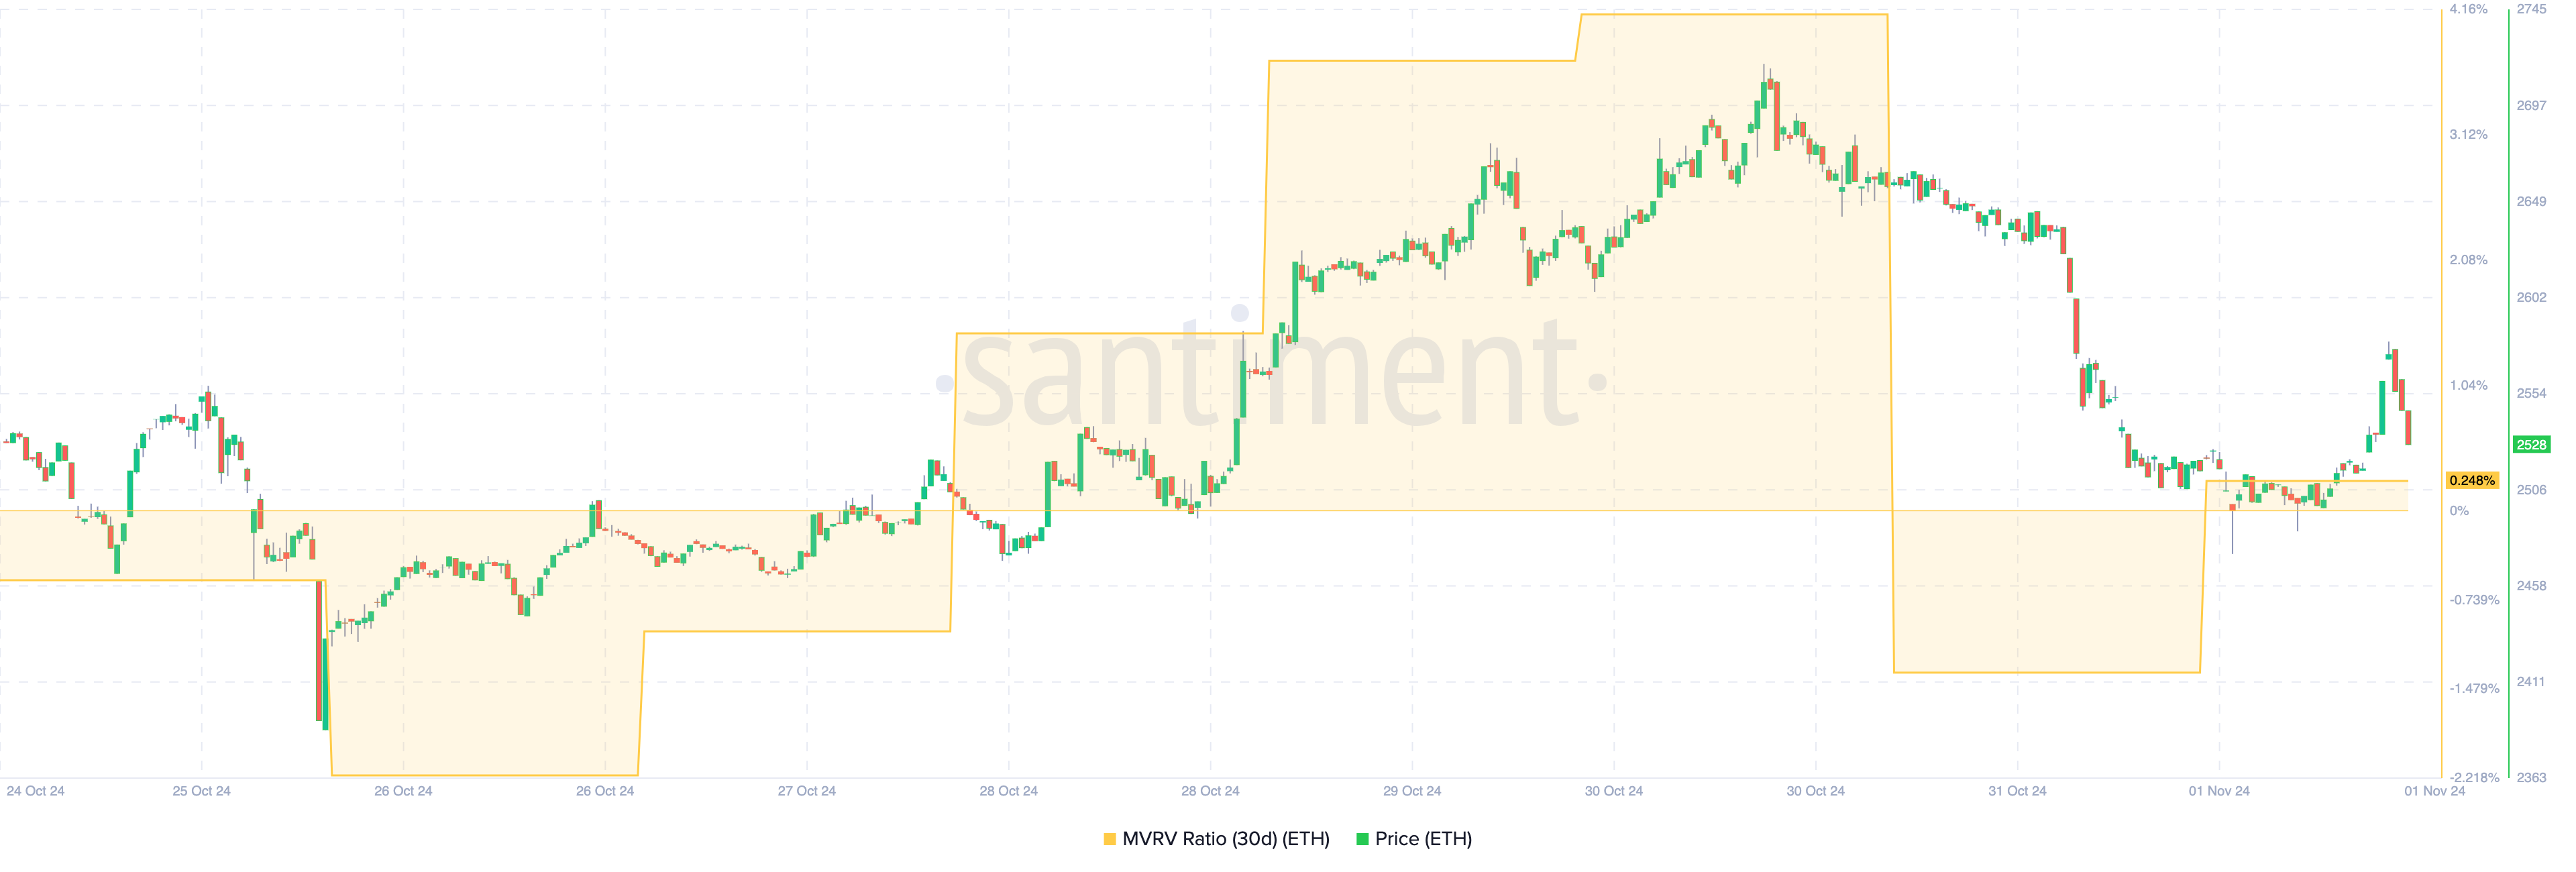
Another metric supporting the bias is the 30-day Market Value to Realized Value (MVRV) ratio. The MVRV ratio compares a crypto asset’s current market value to its realized value, offering insights into market tops and bottoms.
When the MVRV ratio is high, it often signals that the asset might be overvalued, suggesting a market top. Conversely, a low MVRV ratio can indicate undervaluation, pointing toward a potential bottom.
As of now, Ethereum’s MVRV ratio has turned positive, a shift last seen in mid-October, which coincided with ETH’s price surge above $2,700. This historical pattern suggests that if the MVRV ratio continues to rise, we could see a similar upward movement in Ethereum’s price.
 Ethereum MVRV Ratio. Source: Santiment
ETH Price Prediction: Rebound Likely
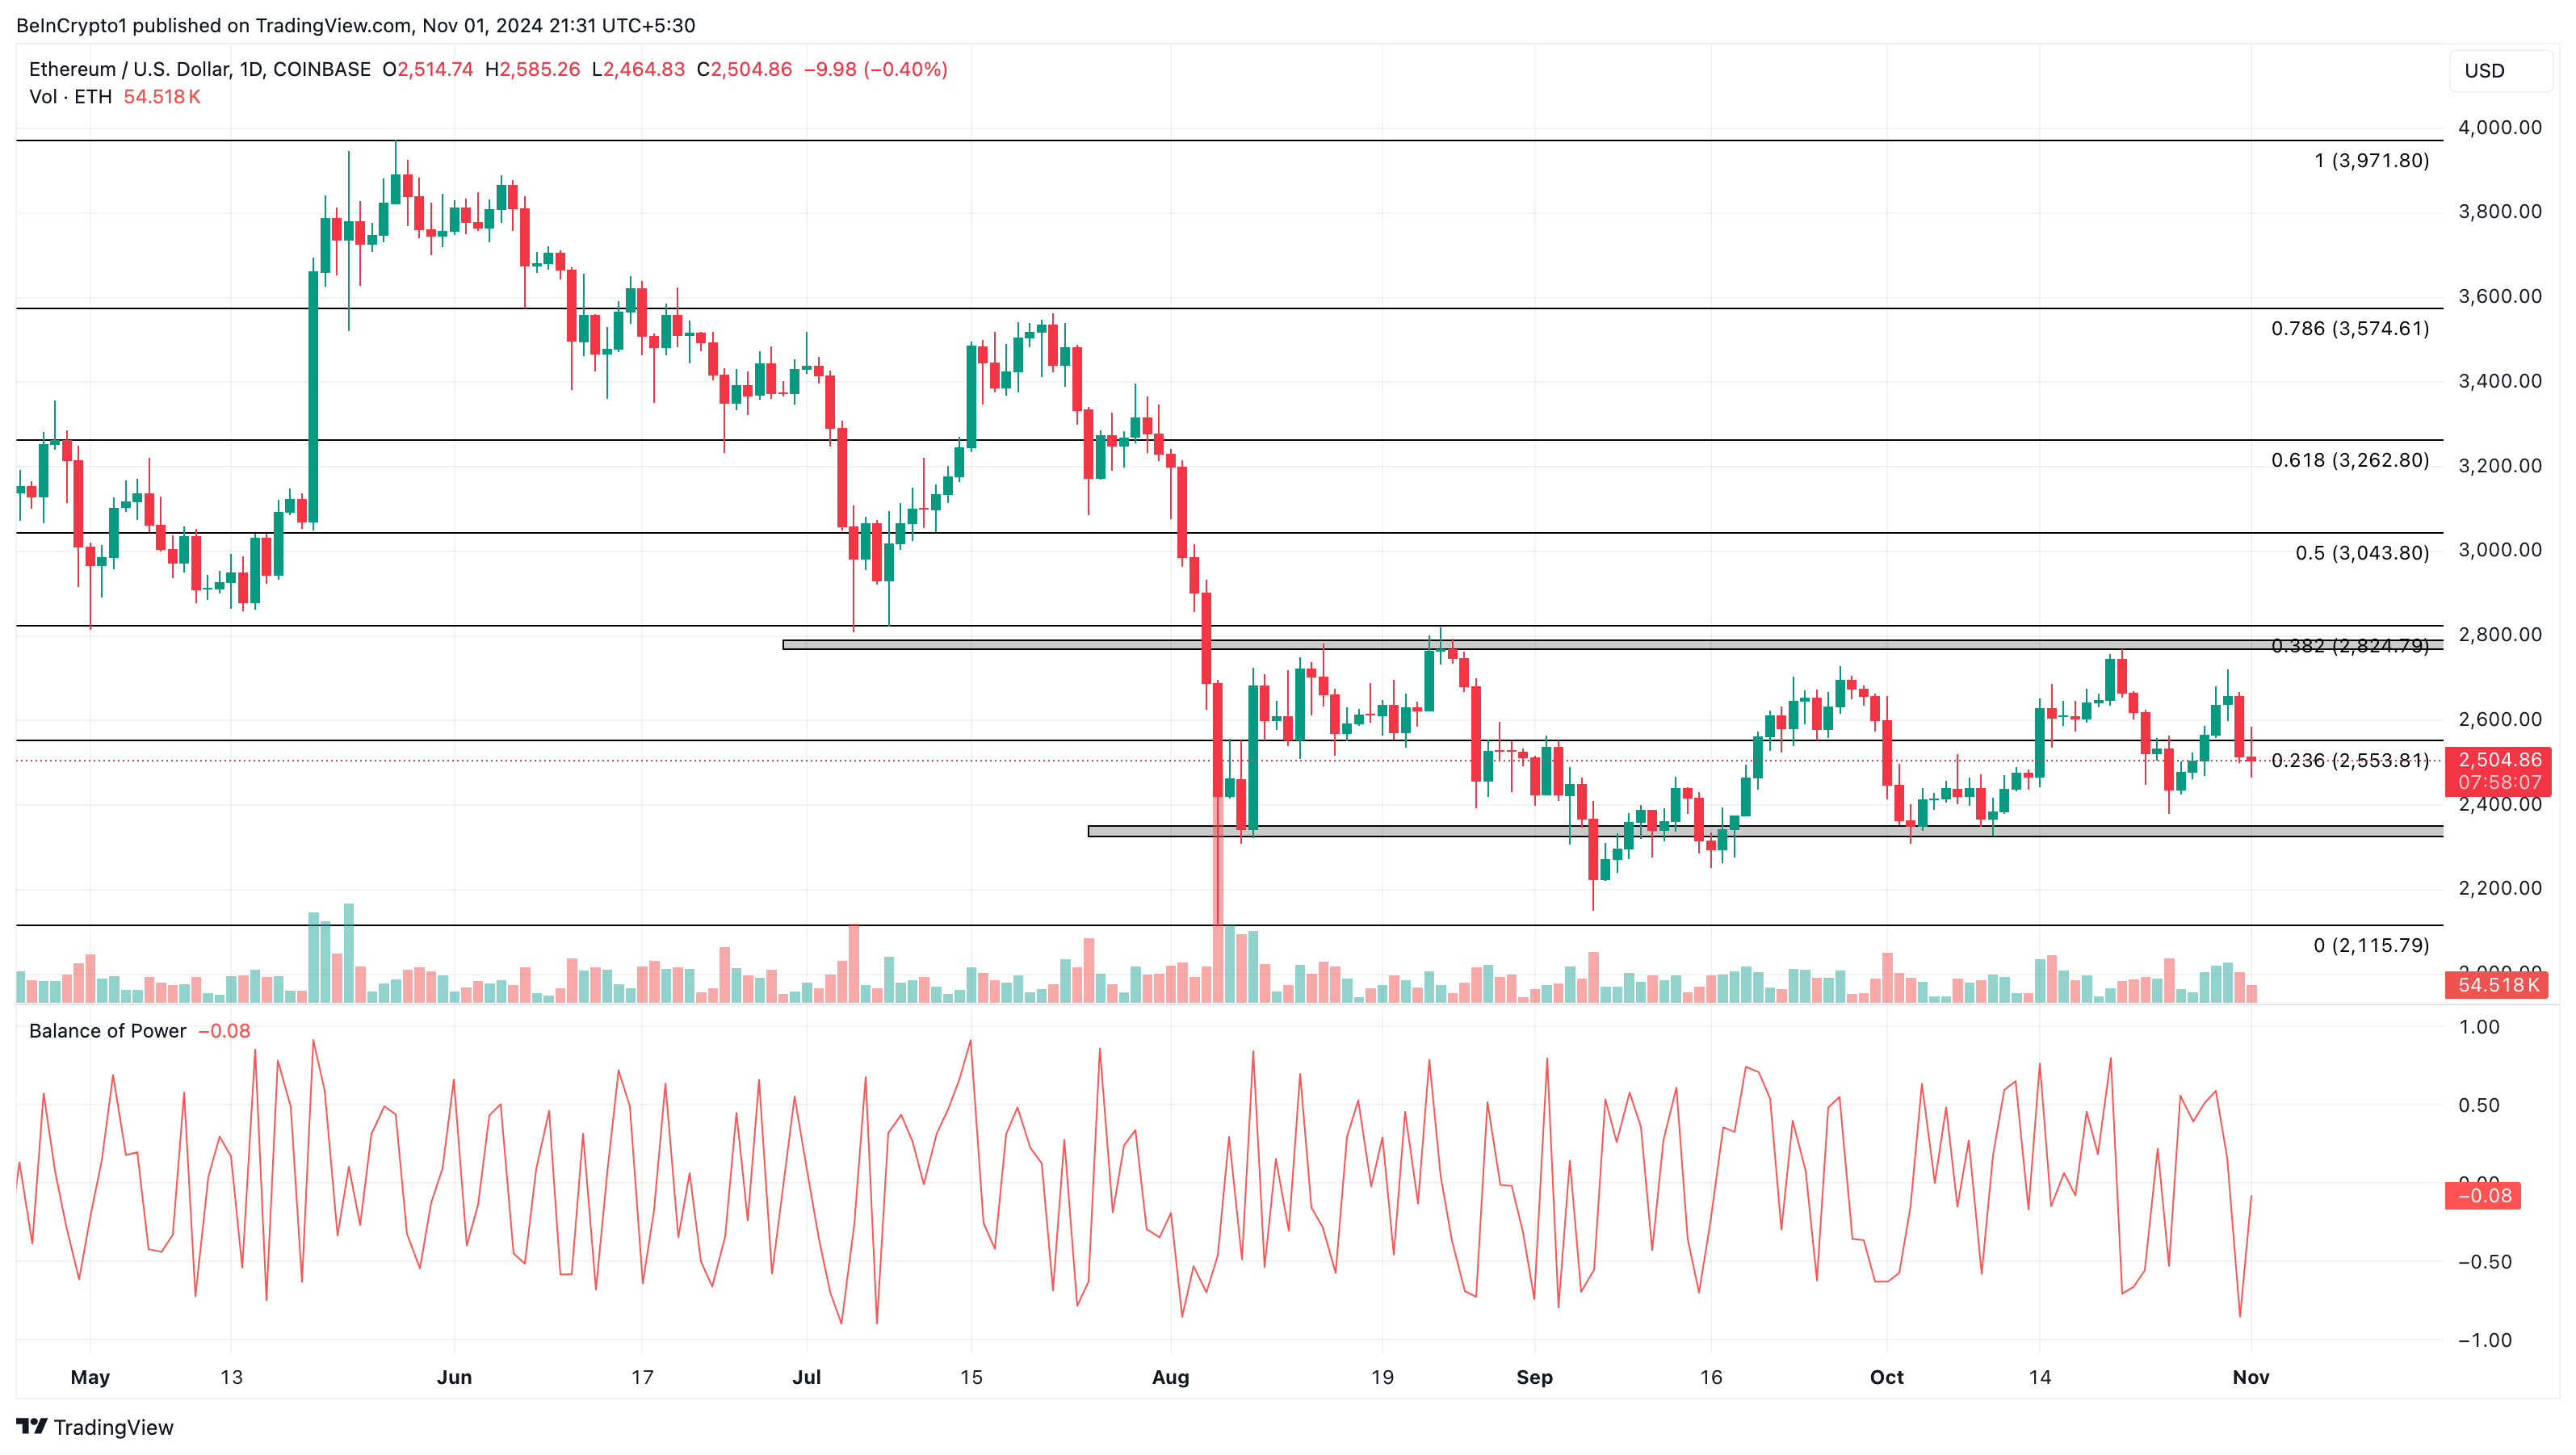
On the daily chart, Ethereum’s price is on the verge of dropping below $2,500. While this might play out, the support around $2,345 is likely to help the altcoin rebound.
However, if that happens, the cryptocurrency will have the resistance at $2,790 to contend with. As seen below, the Balance of Power (BoP) indicator has jumped. The BoP measures the strength of bulls compared to bears.
When the reading decreases, bears are in control. But when the BoP rises, bulls are in control, which appears to be the case at the time of writing. Should this remain the same, then Ethereum’s price might rise to $2,824.
Read more: Ethereum (ETH) Price Prediction 2024/2025/2030
 Ethereum Daily Price Analysis. Source: TradingView
In a highly bullish scenario, ETH could rise as high as $3,262. On the other hand, a decline below the support could invalidate this bias. In that scenario, ETH could drop to $2,115.
The post Ethereum Sets Sights on $2,800 Recovery After Momentum Builds Post-Dip appeared first on BeInCrypto.
