Ethereum’s Gas Fees Plunge to Five-Year Lows, Eyes on $2,300

The post Ethereum’s Gas Fees Plunge to Five-Year Lows, Eyes on $2,300 appeared first on Coinpedia Fintech News
Amid this ongoing market downturn, recently Ethereum (ETH) is gaining significant attention from the crypto community. On August 19, 2024, the on-chain security analytic firm Kaiko made a post on X (previously Twitter) stating that Ethereum’s gas fees have made a five-year record low.
Ethereum’s Gas Fees Hit Five-Year LowsAccording to Kaiko, this record decline in gas fees means less ETH will be burned, leading to a quicker increase in its supply. However, data indicates that ETH’s total supply has been consistently rising since April 2024, as a result, its price has consistently fallen since then.
Kaiko: Ethereum’s gas fees have recently hit five-year lows. This fee reduction has implications for ETH, as lower fees mean less ETH is burned, increasing the token’s supply. ETH’s total supply has risen consistently since April. Despite demand drivers like spot ETH ETFs, this… pic.twitter.com/gTfQhwaMKA
— Wu Blockchain (@WuBlockchain) August 19, 2024Following the approval of the spot Ethereum Exchange Traded Fund (ETF) in the United States, the demand for ETH has been continuously increasing from investors and ETF issuers. Despite this strong demand, the growing supply raises the possibility that ETH could experience massive selling pressure and may fall sharply in the coming days.
Amid this record decline, Ryan Lee, chief analyst at Bitget Research, stated, “Every time ETH gas fees drop to rock bottom has often signaled a price bottom in the mid-term.”
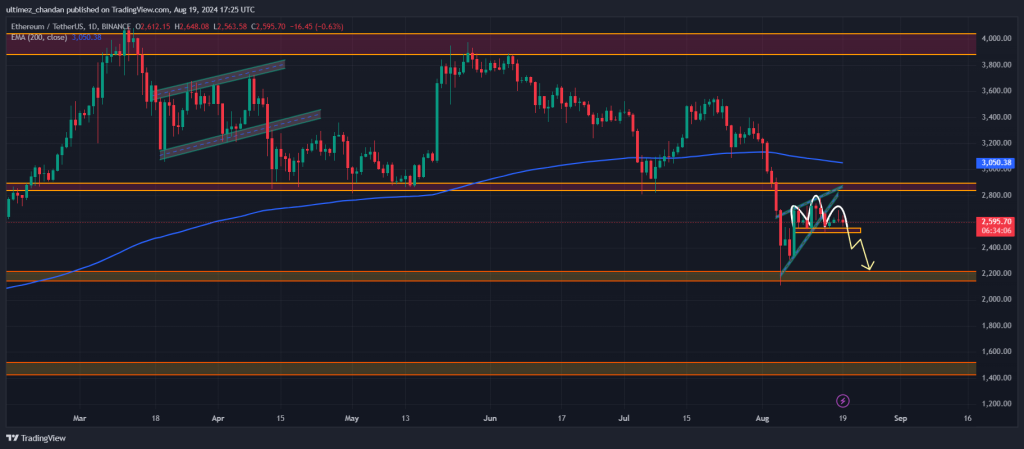
Ethereum Price PredictionAccording to expert technical analysis, ETH looks bearish as it trading below the 200 Exponential Moving Average (EMA) on a daily time frame. In addition to the 200 EMA, it has already broken out a bearish rising wedge price action pattern on a daily time frame. Simultaneously, ETH is also forming a bearish head-and-shoulder price action pattern which makes the overall outlook bearish.
 Source: Trading View
If ETH closes a daily candle below the $2,520 level, there is a high possibility it could fall to the $2,300 level or even lower in the coming days.
Ether Price AnalysisAt the press time, ETH is trading near the $2,590 level and has experienced a price drop of over 3% in the last 24 hours. Meanwhile, its trading volume increased by 30% during the same period, indicating higher participation from investors and traders, amid the market decline.
Whereas, ETH’s open interest has remained unchanged in the last 24 hours, which means interest from traders is neutral.
