Dogecoin (DOGE) Stays Under Long-Term Resistance While Bulls Lose Their Grip
Dogecoin’s (DOGE) recent effort to break above the upper line of its falling wedge pattern was met with resistance from bears. The increased selling pressure pushed DOGE’s price below its 20-day exponential moving average (EMA).
As buying pressure diminishes, Dogecoin may continue to move within this downward channel for a bit longer.
Dogecoin Sellers Prevent Rally Above Upper TrendlineReadings from DOGE’s one-day chart show that the meme coin has been trading within a falling wedge pattern since March. This pattern is formed by two downward-sloping trend lines, where the upper line acts as resistance and the lower as support.
While the wedge moves downward, it’s typically considered a bullish pattern because, once completed, prices often break above the upper trendline, indicating that buyers have overpowered sellers.
However, DOGE’s falling wedge has narrowed over the past few months, the inability to sustain a rally above the upper trend line suggests significant selling pressure at that level. Its recent price drop below its 20-day EMA signals that bearish activity dominates the meme coin’s market as buying activity plummets.
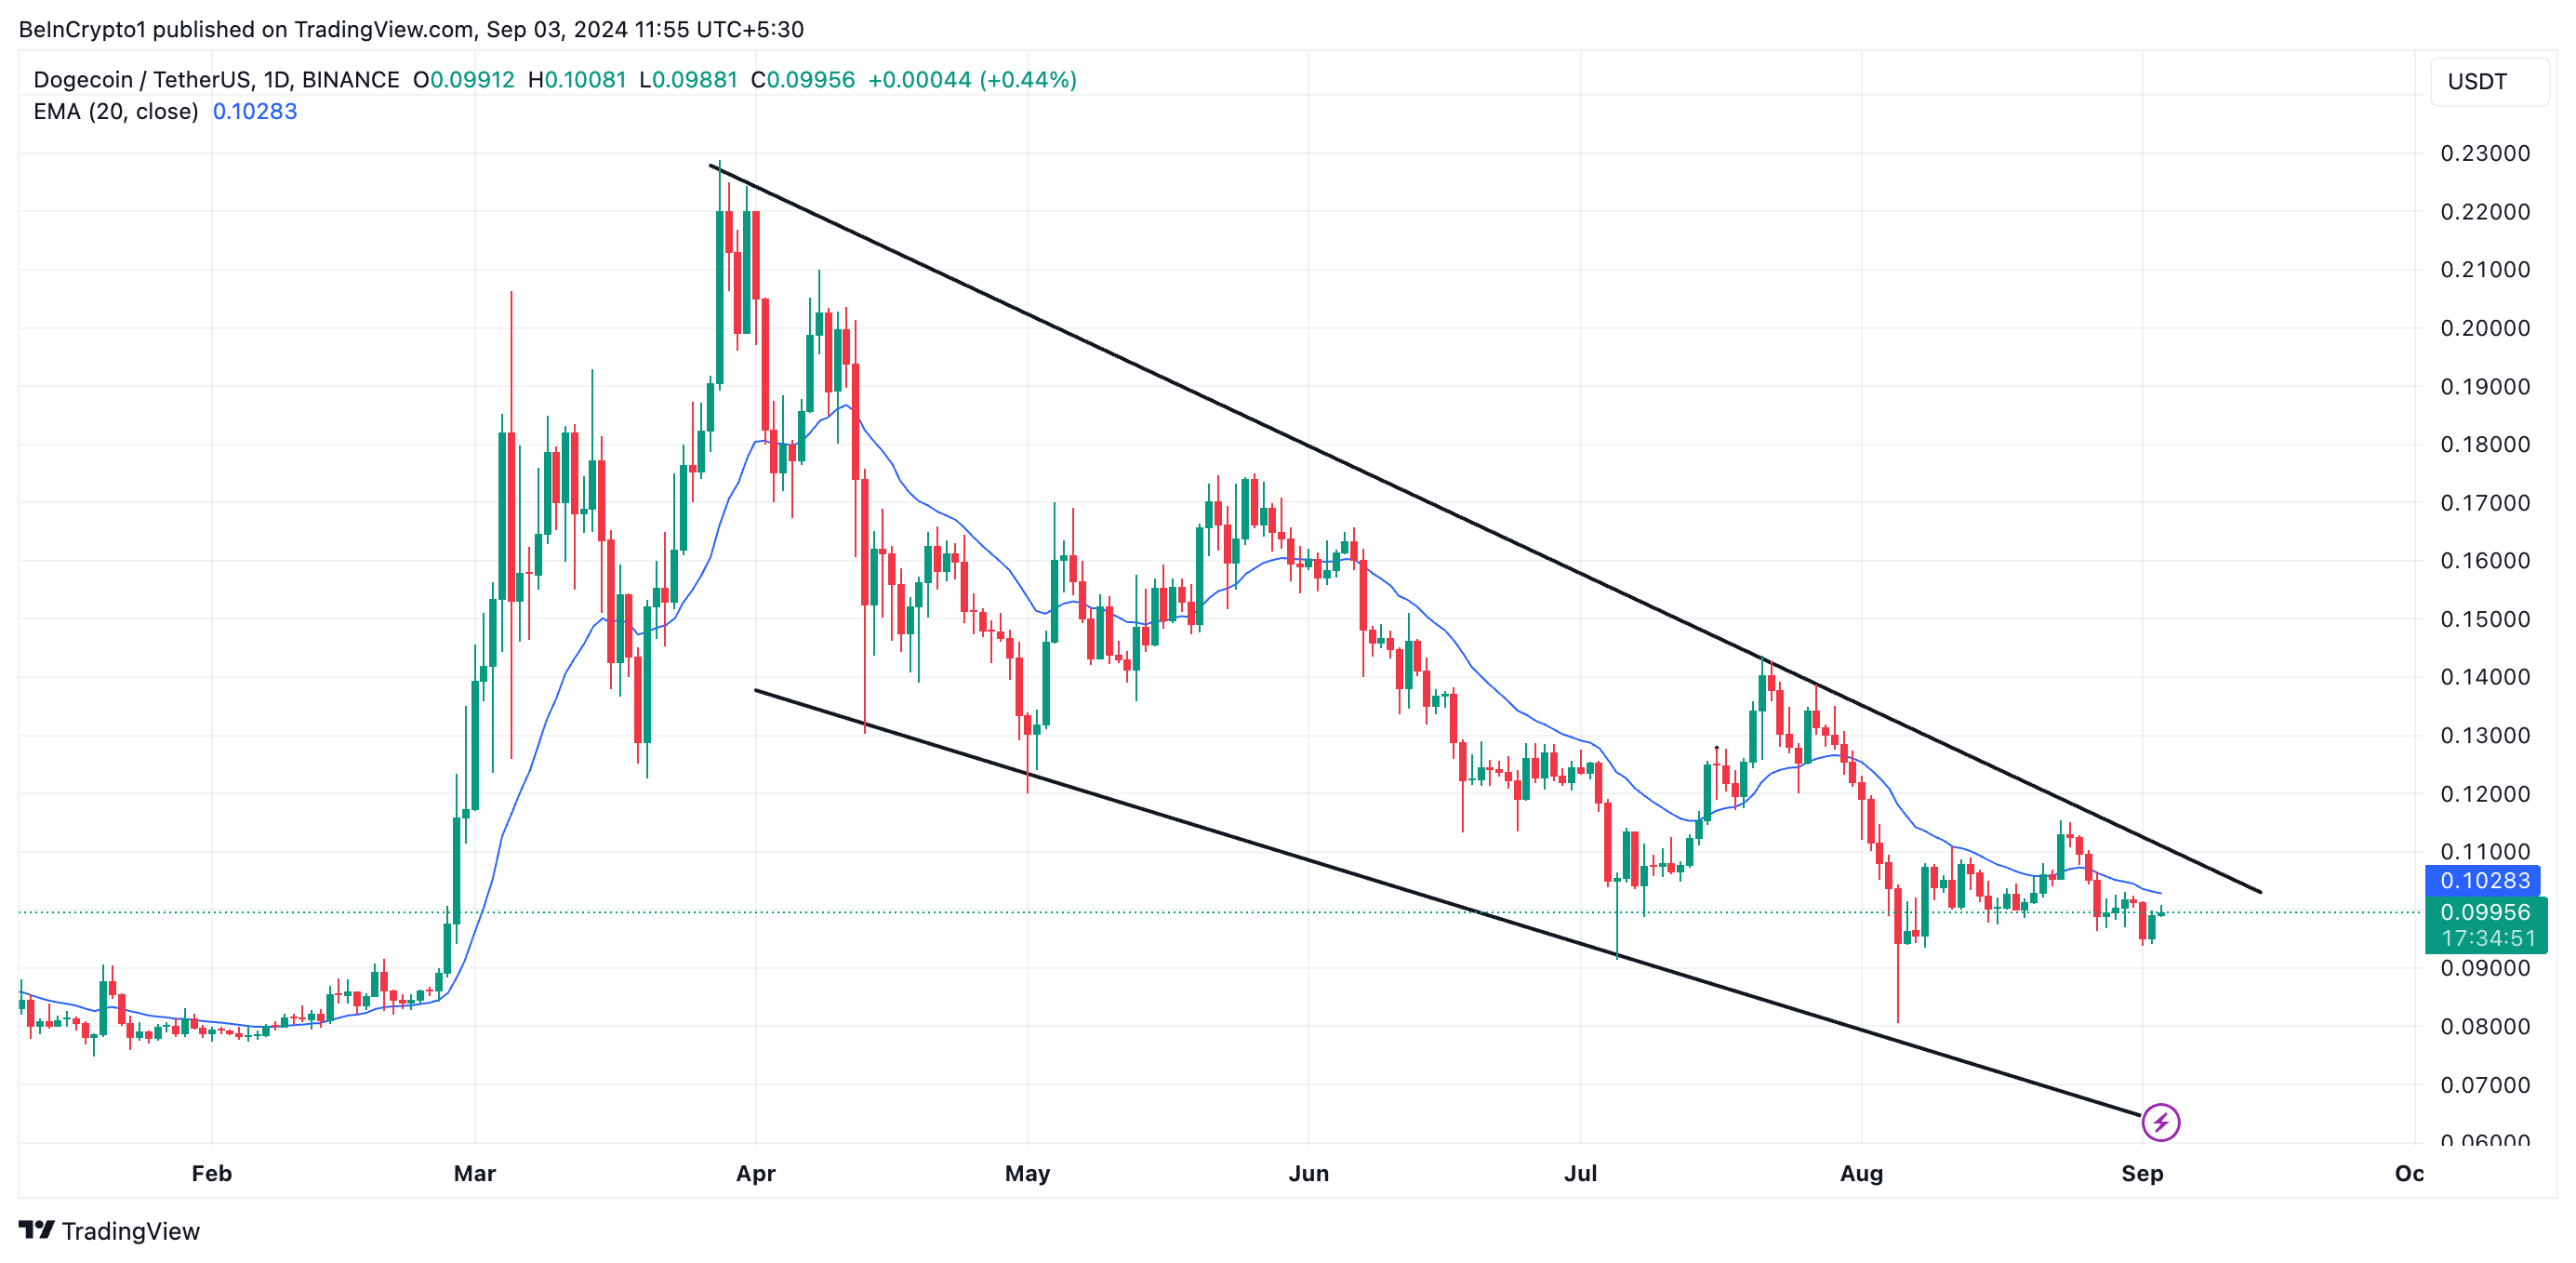 Dogecoin Price Analysis. Source: TradingView
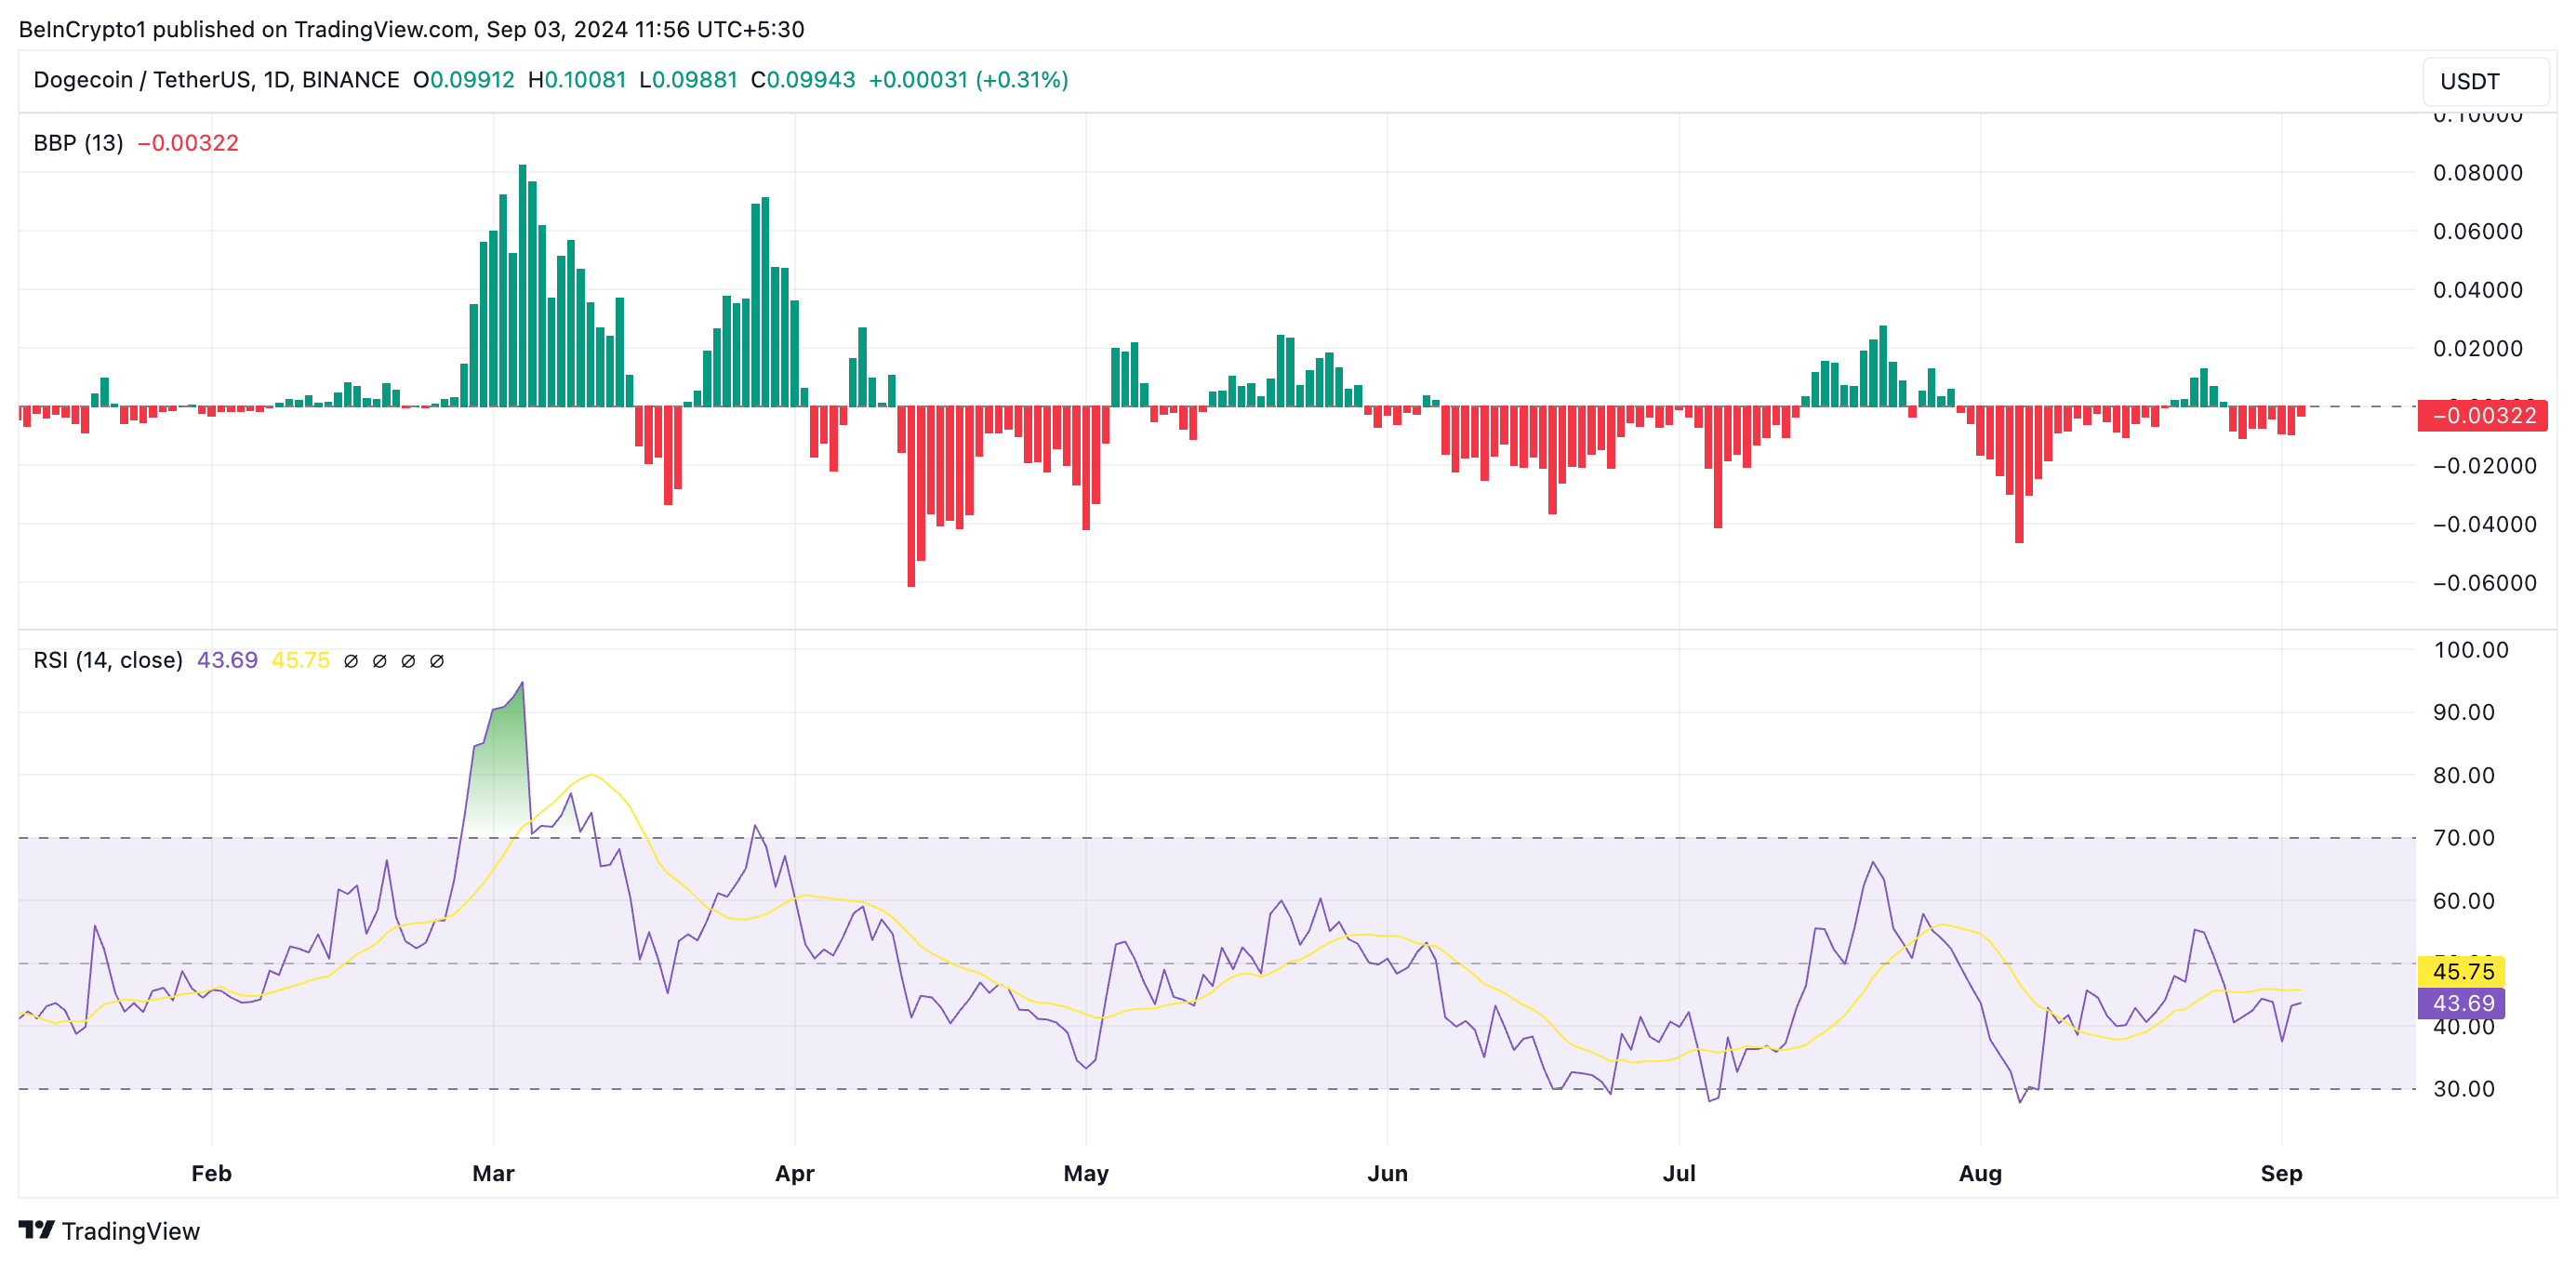
DOGE’s Elder-Ray Index supports the bearish outlook, with a current value of -0.0032, indicating that sellers are dominating the market. Additionally, DOGE’s Relative Strength Index (RSI) is below the neutral 50 mark, standing at 43.74, further signaling that selling activity outweighs buying in the DOGE market.
These indicators highlight the strong bearish sentiment, suggesting that a rally above the upper trendline of the falling wedge pattern may be unlikely in the near term.
Read more: Dogecoin (DOGE) Price Prediction 2024/2025/2030
 Dogecoin Price Analysis. Source: TradingView
DOGE Price Prediction: Futures Traders Remain Optimistic
Dogecoin Price Analysis. Source: TradingView
DOGE Price Prediction: Futures Traders Remain Optimistic
Despite DOGE’s price troubles, its futures traders have mostly demanded long positions, as shown by its consistently positive funding rates. Funding rates keep the price of perpetual futures contracts aligned with the spot price.
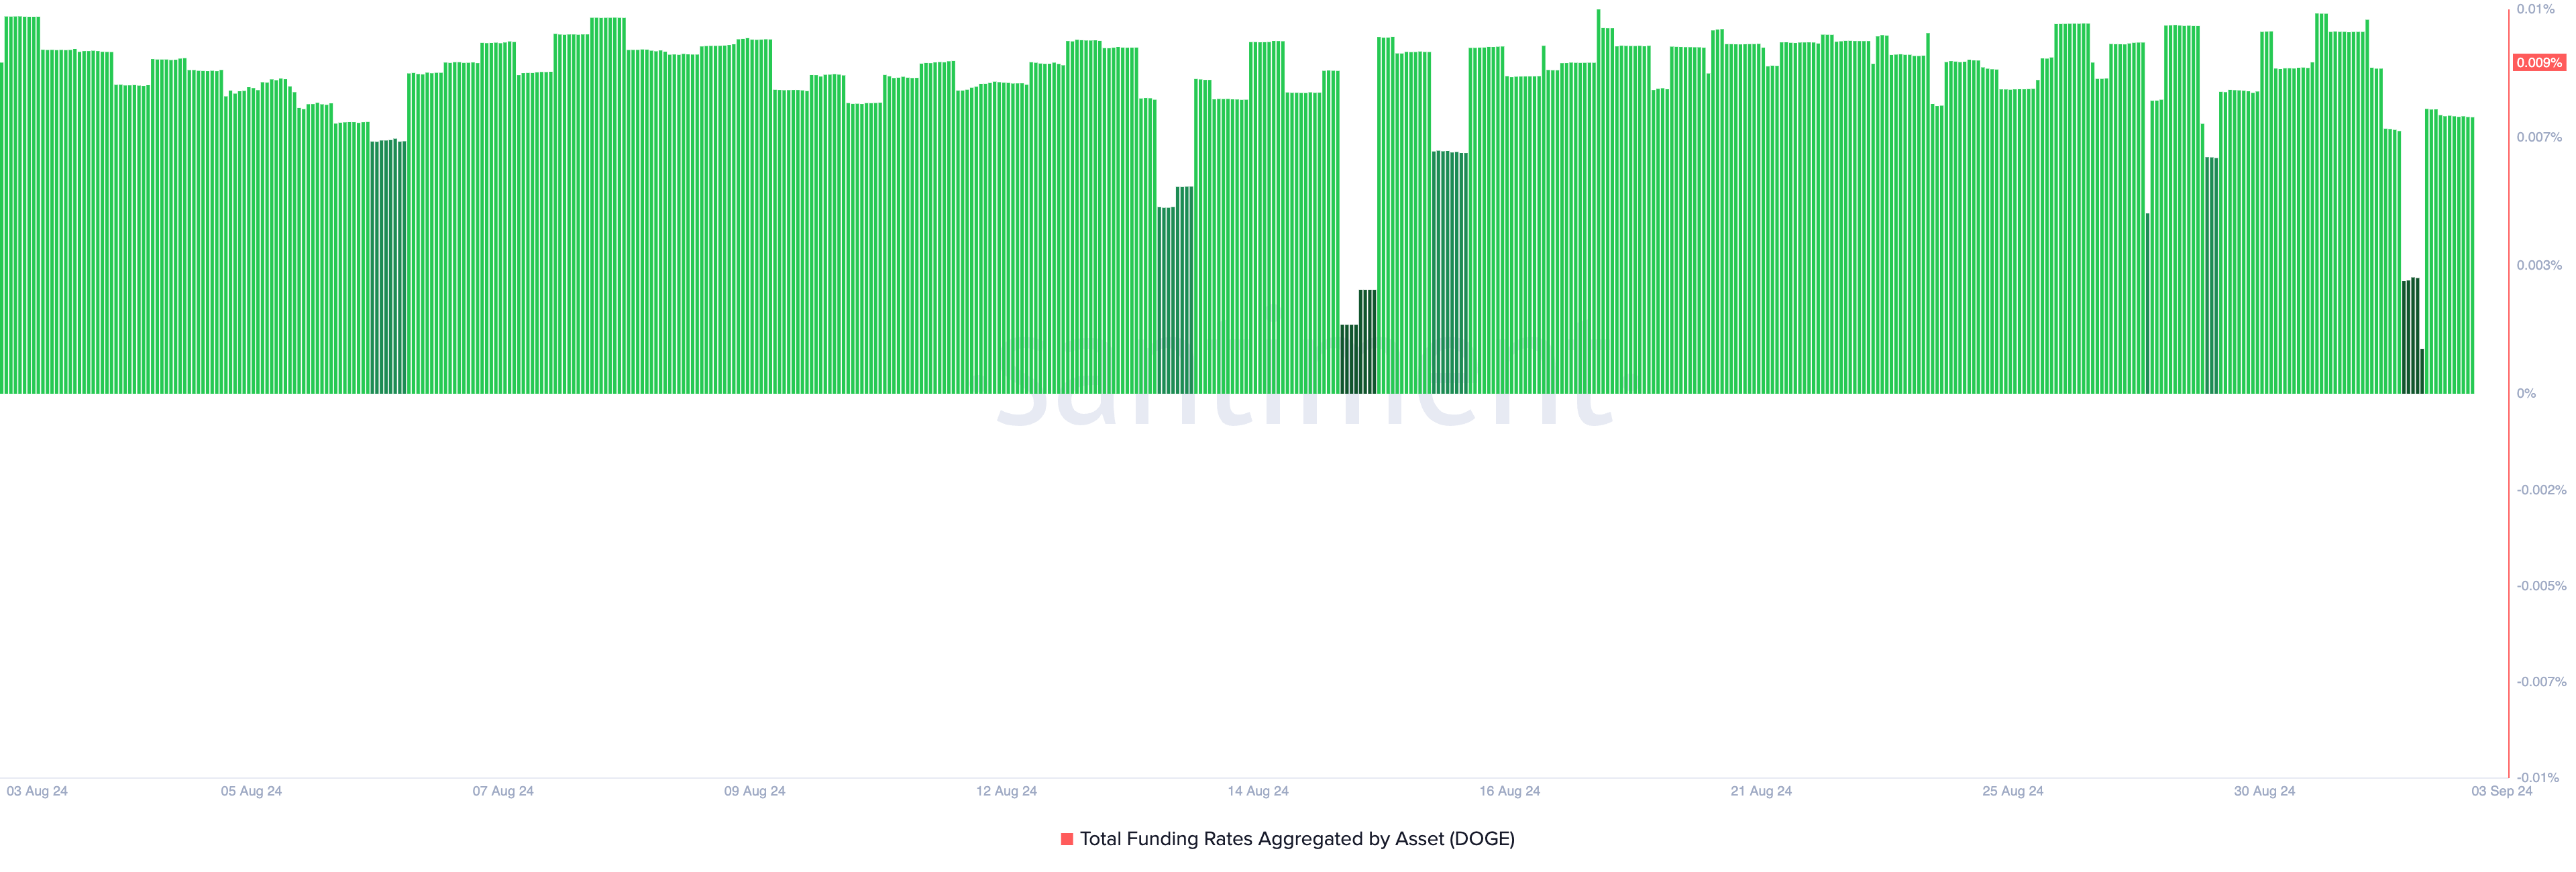 Dogecoin Funding Rate. Source: Santiment
When they are positive, there are more long positions than short ones. This means that more traders are opening positions in favor of a price rally than those holding the coin in hopes of a decline.
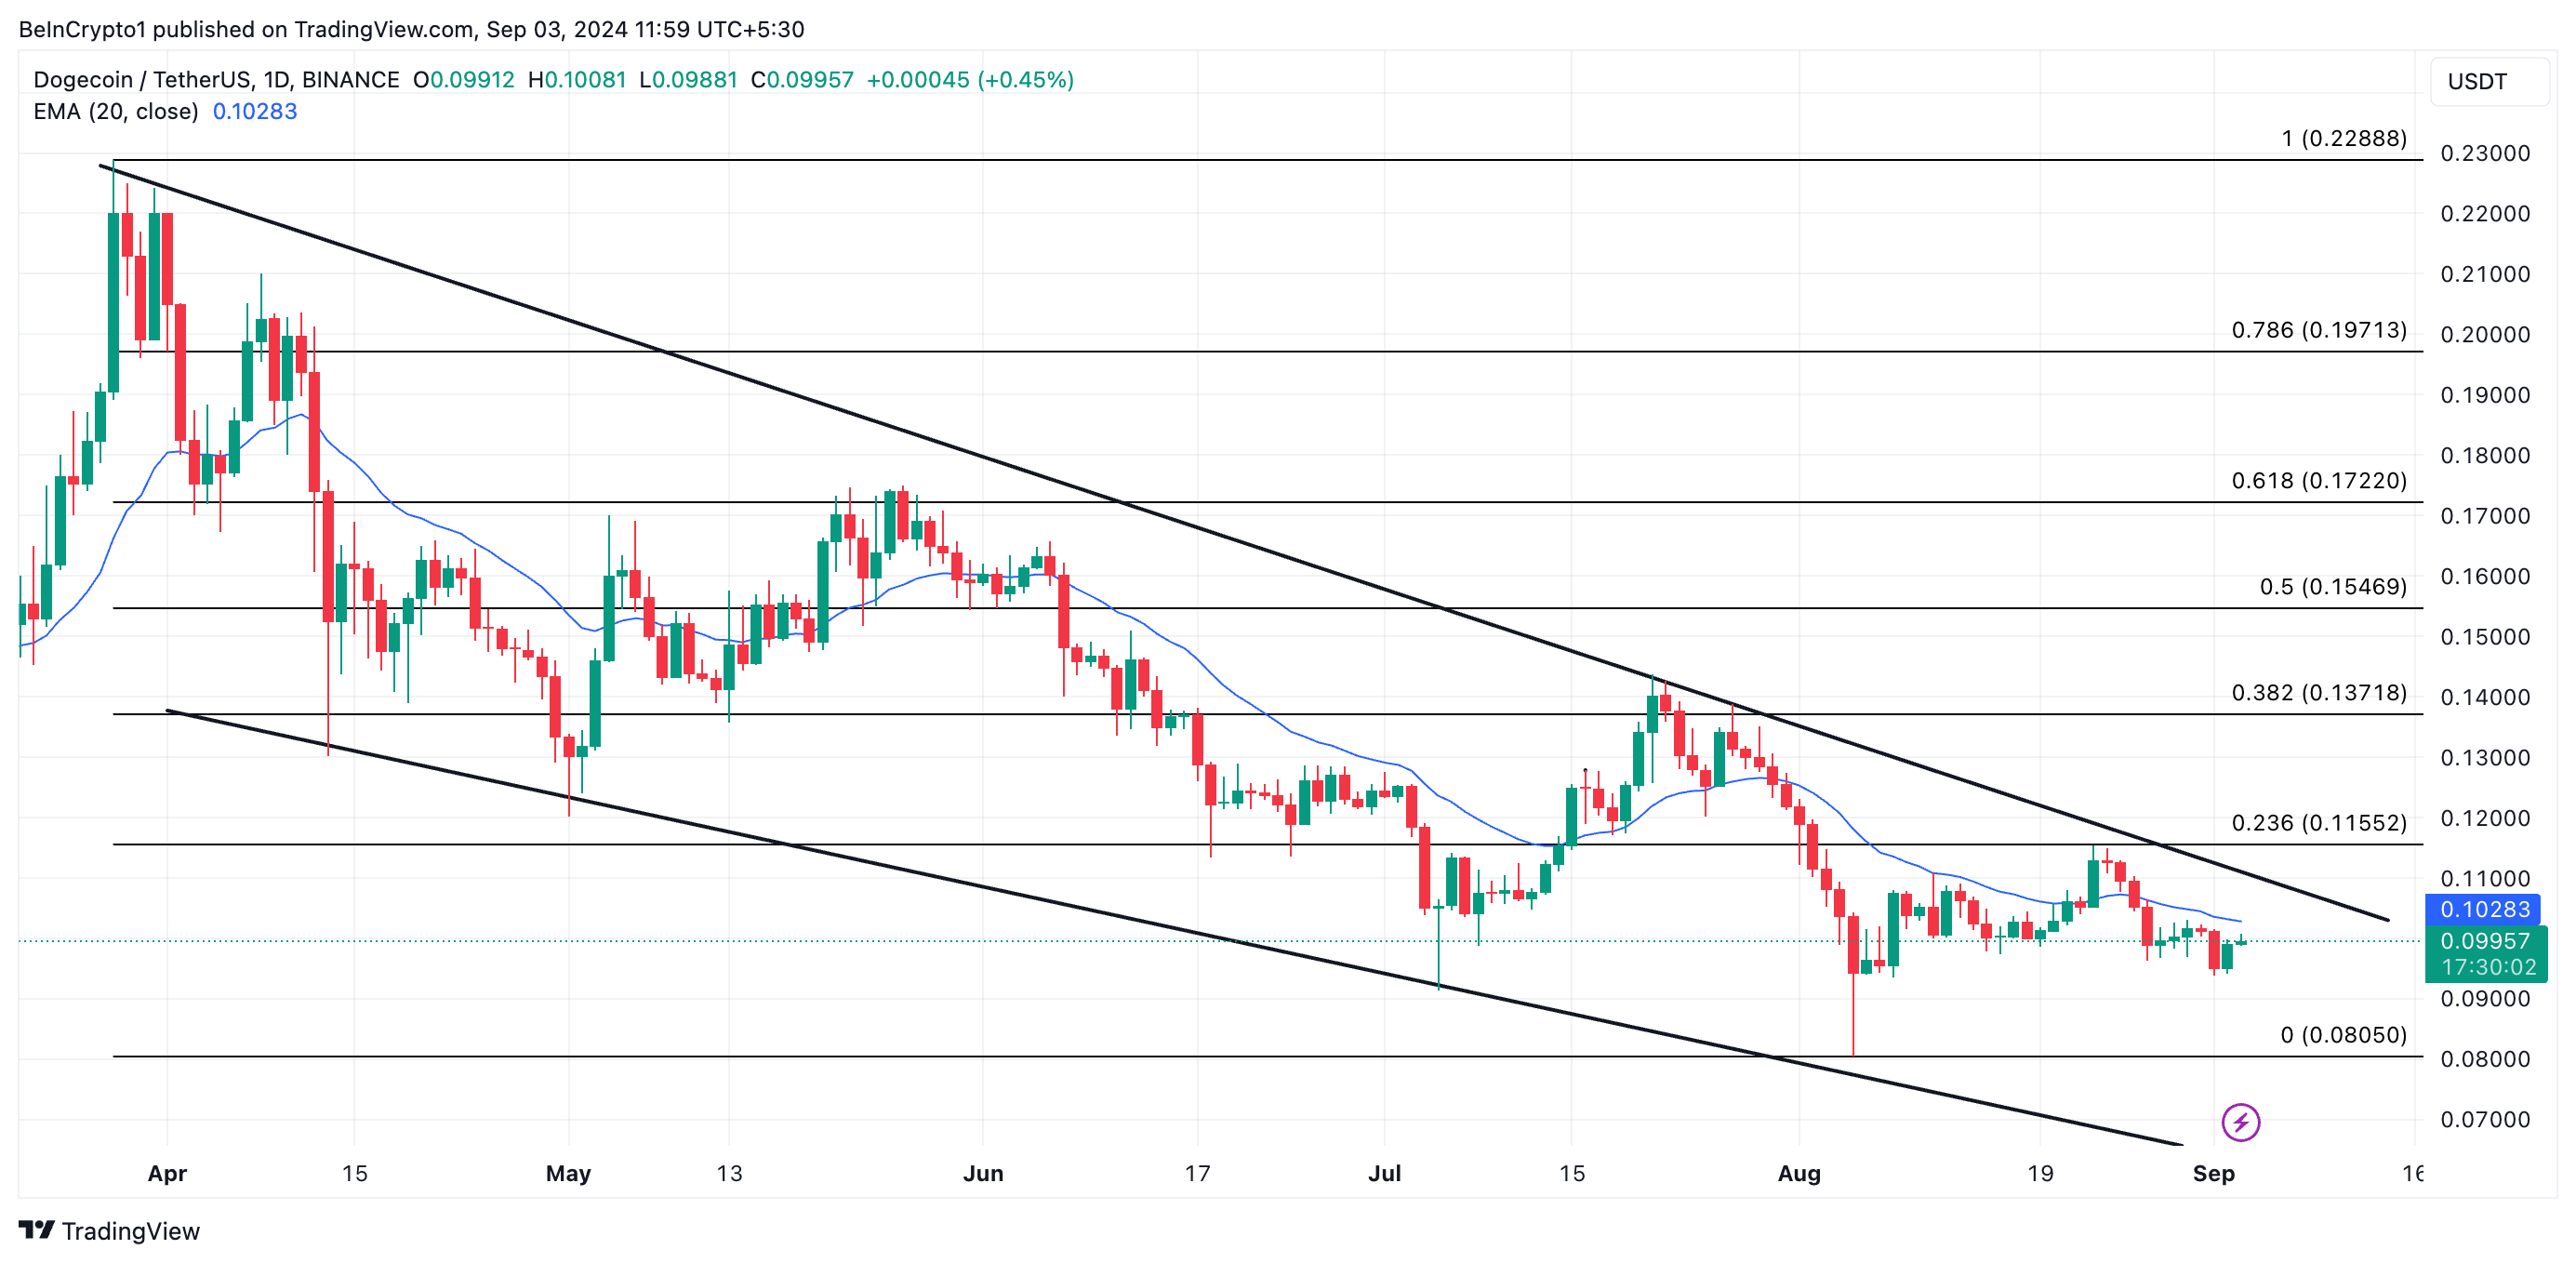
If DOGE witnesses a surge in demand that pushes it above its 20-day EMA and past the upper trendline of its falling wedge pattern, it will exchange hands at $0.11. If the uptrend continues, it will rally toward $0.13.
Read more: Dogecoin (DOGE) vs Shiba Inu (SHIB): What’s the Difference?
 Dogecoin Price Analysis. Source: TradingView
However, if selling pressure continues to mount, the leading meme coin will revisit its August 5 low of $0.08.
The post Dogecoin (DOGE) Stays Under Long-Term Resistance While Bulls Lose Their Grip appeared first on BeInCrypto.