Dogecoin (DOGE) Price Nears Pattern End: Traders on Alert
The Dogecoin (DOGE) price trades in the upper portion of a long-term pattern that has existed since June 2023.
DOGE broke out from a short-term diagonal resistance and is approaching a horizontal one.
Dogecoin Approaches Long-Term ResistanceThe weekly time frame shows that the DOGE price has traded inside an ascending parallel channel since June 2023. DOGE broke out from the channel on December 4, leading to a high of $0.108 later in the month. This was a new 2023 high.
However, the price failed to sustain its increase and fell inside the channel’s confines. Then, it validated its resistance trend line twice (red icons). Despite this bearish development, the Dogecoin price did not break down from the middle of the pattern. Rather, it began a bounce and is approaching its resistance trend line again.
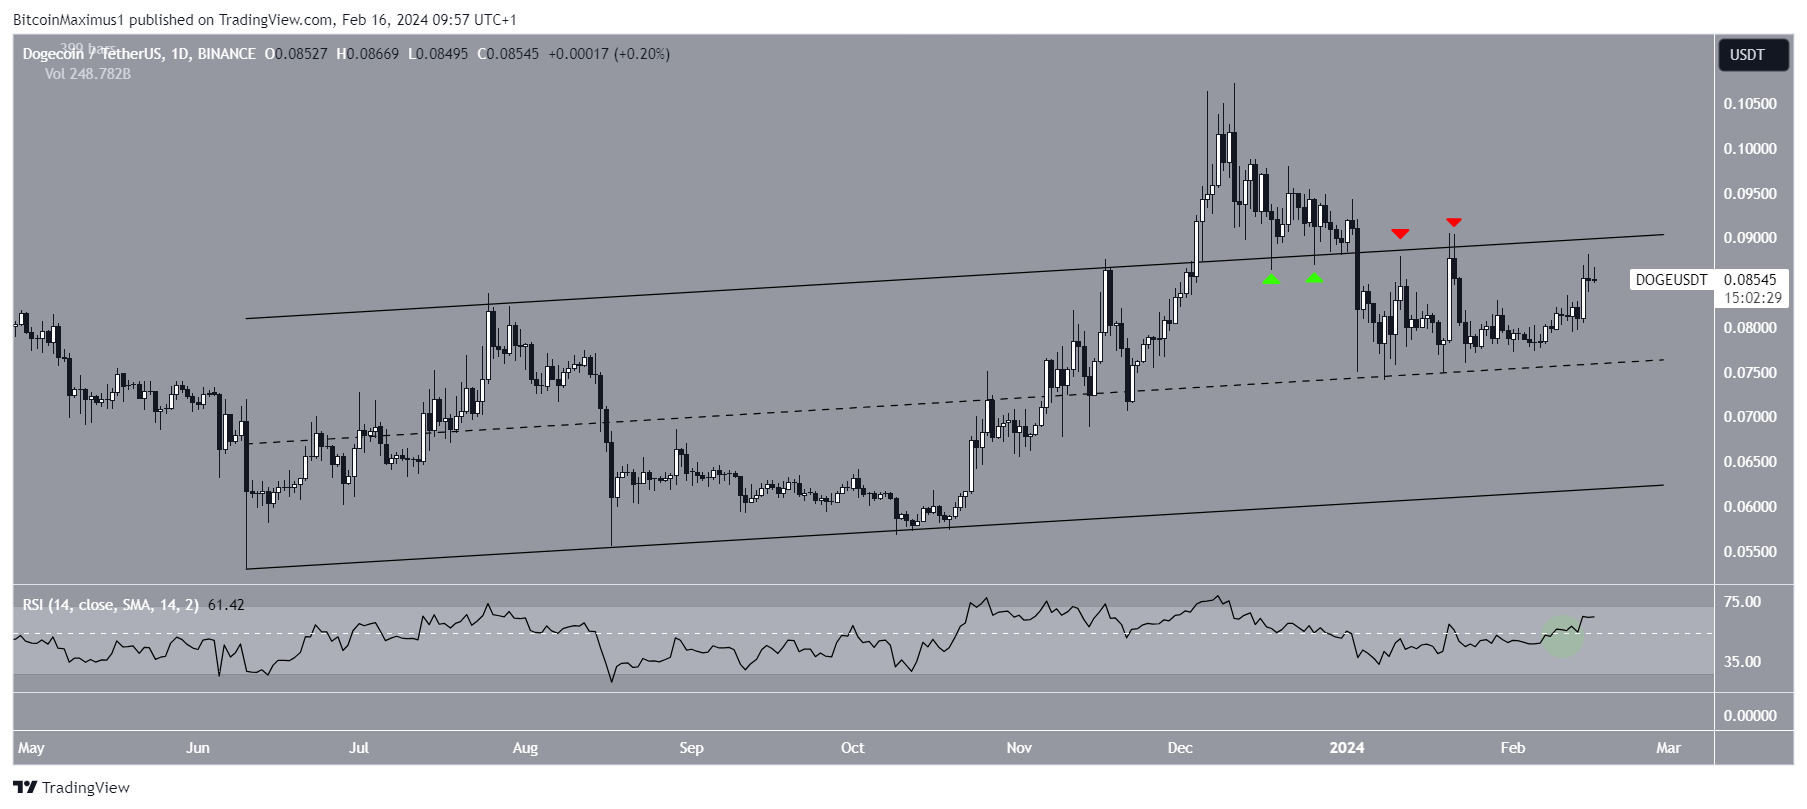 DOGE/USDT Daily Chart. Source: TradingView
The daily Relative Strength Index (RSI) gives a bullish reading. The RSI is a momentum indicator traders use to evaluate whether a market is overbought or oversold and whether to accumulate or sell an asset.
Readings above 50 and an upward trend suggest that bulls still have an advantage, while readings below 50 indicate the opposite. The indicator is above 50 and increasing, both signs of a bullish trend.
Read More: Dogecoin vs. Bitcoin: An Ultimate Comparison
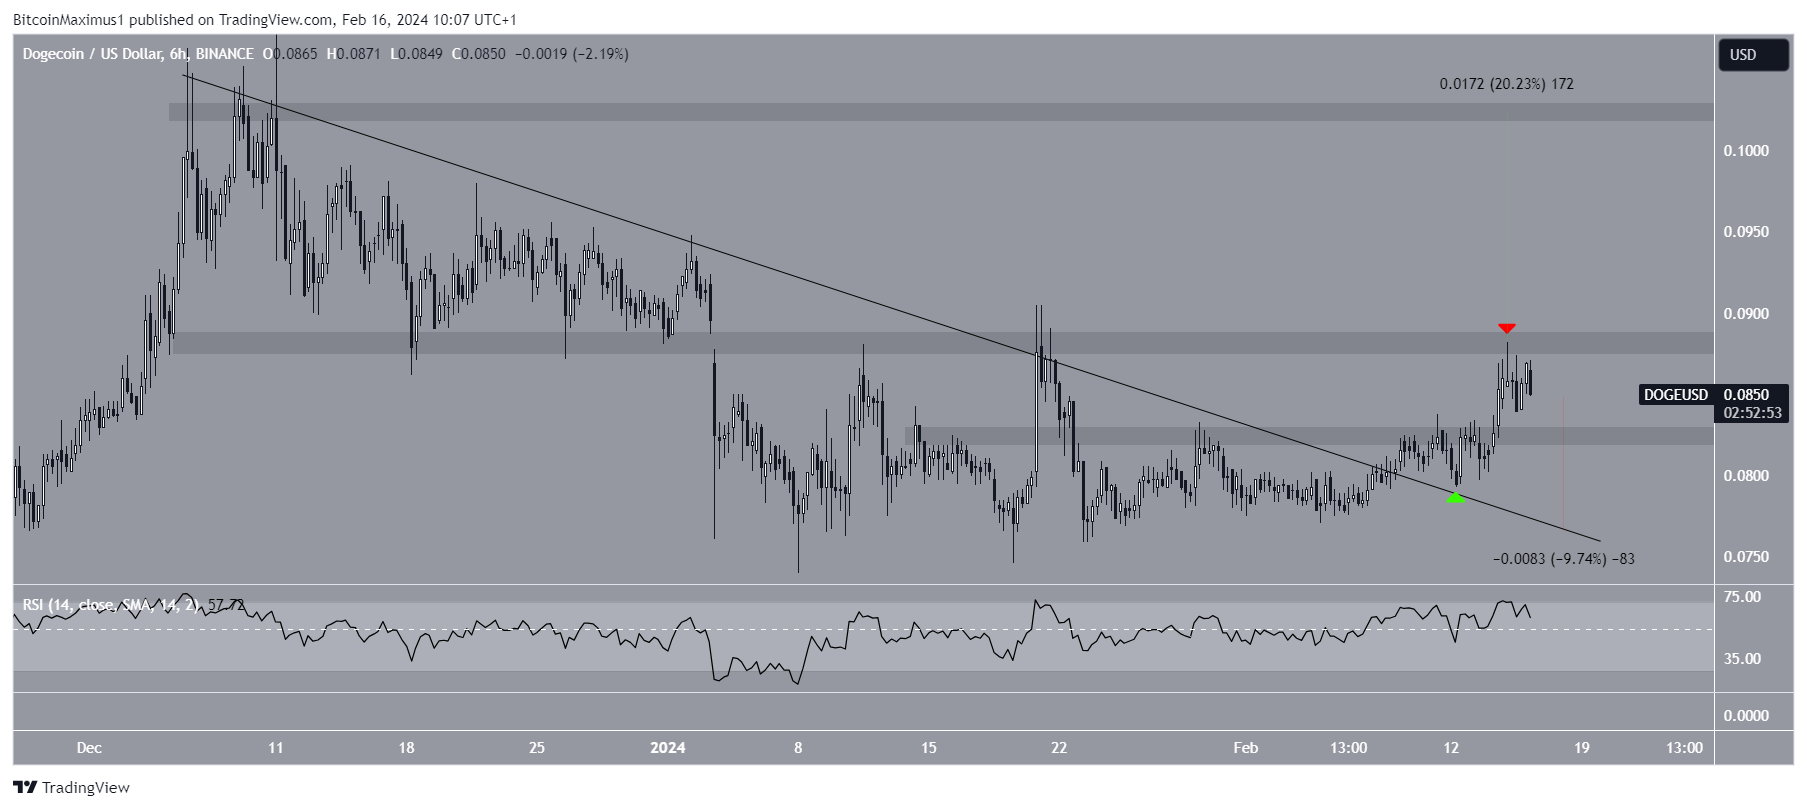
DOGE Price Prediction: Can the Breakout Be Sustained?The technical analysis of the six-hour time frame aligns with the bullish readings from the daily one.
The chart shows the DOGE price broke out from a descending resistance trend line and validated it as support on February 12 (green icon). This is a common movement after breakouts that usually leads to trend continuation.
Read More: How to Buy Dogecoin (DOGE) Anonymously
Despite increasing, DOGE did not break out from the $0.088 horizontal resistance area. Rather, it was rejected (red icon) and has fallen slightly. However, the price still trades above the breakout level and minor $0.083 support.
If the DOGE price breaks out above $0.088, it can increase to the next resistance at $0.102, also breaking out from the long-term channel.
 DOGE/USDT Daily Chart. Source: TradingView
Despite this bullish DOGE price prediction, closing below the $0.083 level can trigger a 10% decrease to the descending resistance trend line at $0.077.
For BeInCrypto‘s latest crypto market analysis, click here
Best crypto platforms in Europe | February 2024The post Dogecoin (DOGE) Price Nears Pattern End: Traders on Alert appeared first on BeInCrypto.