Dogecoin (DOGE) Faces Bearish Technical Dynamics: A Closer Look
In this analysis, we will examine the price action of Dogecoin (DOGE) using technical analysis.
To understand the current market dynamics and provide strategic insights, we’ll focus on the role of the Ichimoku cloud, the Tenkan-sen (red line), and the 100 EMA (blue line).
Dogecoin’s Future: The Impact of Emerging Bearish TrendsThe price of DOGE is currently trading between the Tenkan-sen and the 100 EMA in the 4H timeframe. After attempting to Tenkan plateau (in red) of the 4H Ichimoku cloud located at $0.16, DOGE failed to sustain the upward movement, indicating a bearish development.
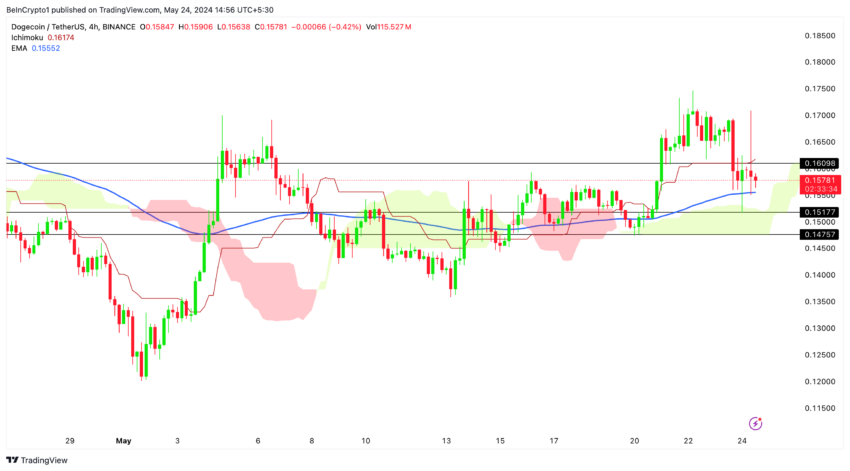 DOGE/USDT (4H): TradingView
The 4H – 100 EMA (Exponential Moving Average) is a critical mid-term support level.
The Ichimoku Cloud, or Ichimoku Kinko Hyo, is a comprehensive indicator used in technical analysis. It defines support and resistance, identifies trend direction, gauges momentum, and provides trading signals.
It consists of five lines, with the Tenkan-sen being the most important. The Tenkan-sen is crucial for determining price trends and identifying key support and resistance levels, especially when it flattens to form a plateau.
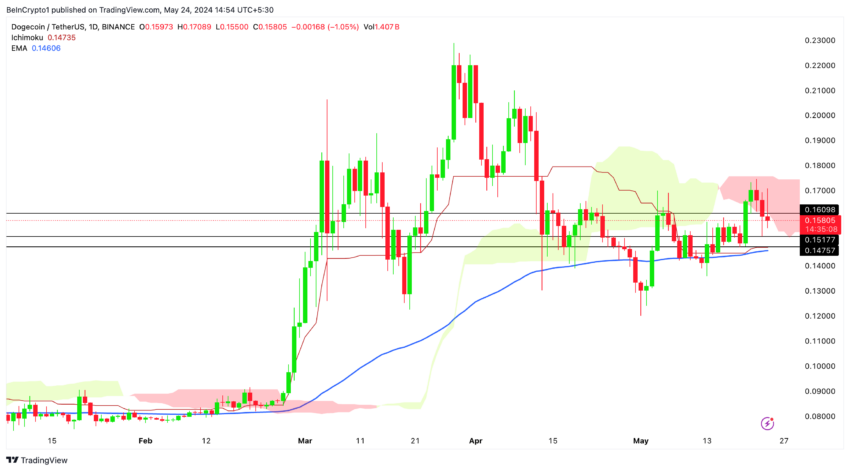 DOGE/USDT (1D): TradingView
The daily Ichimoku cloud is an important resistance level that DOGE needs to overcome to shift the outlook to bullish. The price is attempting to exit to the downside of the daily Ichimoku cloud, which would reinforce the bearish sentiment.
If the price remains below this level, it may continue to face downward pressure.
Dogecoin: $20B Market Cap as Psychological ThresholdThe market capitalization of Dogecoin (DOGE) fluctuates around an important range (20 to 30 Billion USD), as illustrated in the provided chart. Understanding the implications of this fluctuation is crucial for anticipating future market movements and potential bearish developments.
This range acts as a crucial zone of support and resistance, influencing the price dynamics of DOGE.
If DOGE’s market cap fails to maintain its position within this critical range and drops significantly. This could trigger a bearish trend. This drop would indicate a lack of investor confidence and could lead to increased selling pressure. Such a scenario might result in DOGE’s price declining further as the market seeks a new lower support level.
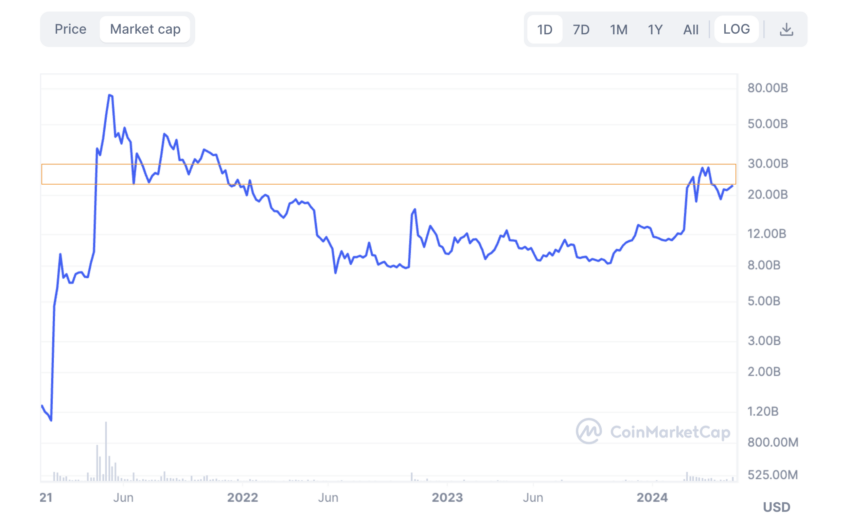 Doge Market Capitalization: CoinMarketCap
Strategic Recommendations
Doge Market Capitalization: CoinMarketCap
Strategic Recommendations
Monitor Key Levels: Watch the $20 billion market cap as a critical psychological level. If the market cap falls below this, look for support around $16 billion. Key resistance levels to watch are $25 billion and $30 billion. Technical supports to monitor include the daily 100 EMA (blue line) at $0.14606 and the daily Tenkan-sen (red line) at $0.14735.
Price Reversal Scenario: A bullish reversal could be signaled if Dogecoin’s market cap reclaims and sustains above $25 billion, along with a strong price movement breaking above the $0.18 mark and the daily Ichimoku cloud on the daily timeframe.
The post Dogecoin (DOGE) Faces Bearish Technical Dynamics: A Closer Look appeared first on BeInCrypto.