Chainlink (LINK) Witnesses Decline Amid Hike in Daily Transactions
LINK, the native token of the decentralized oracle network Chainlink, has witnessed a significant value dip amid the current general market downturn. Exchanging hands at $11.38 at press time, the value of the 15th largest cryptocurrency asset by market capitalization has plummeted by over 20% in the last week alone.
Interestingly, amid this decline, the number of daily transactions involving the altcoin has spiked. However, this might not be for good reasons.
Chainlink Holders “Dump” Tokens On ExchangesOn-chain data reveals an 18% uptick in LINK’s daily transaction count in the past seven days. This metric tracks the total number of transactions for a crypto-asset on a given day.
When it rises, it suggests an uptick in the demand for an asset and increased user activity on the asset’s network. This is generally a bullish signal that confirms an asset’s uptrend or hints at a potential price rally.
A closer examination of LINK’s on-chain performance reveals a significant increase in its daily large transaction count over the past month.
For example, over the past 30 days, the daily number of LINK transactions valued between $100,000 and $1 million has surged by 82%. Additionally, larger transactions ranging from $1 million to $10 million have seen a 15% increase in their daily count during the same period.
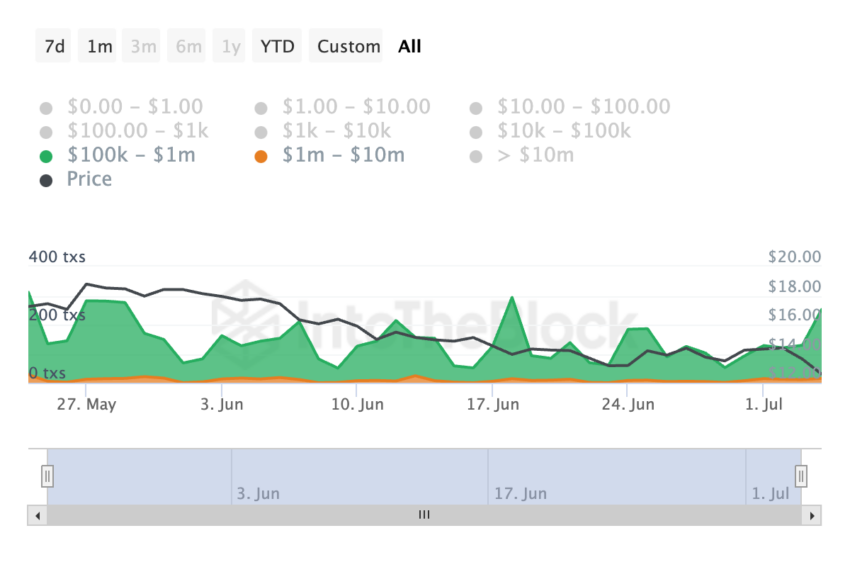 Chainlink Transaction Count by Size. Source: IntoTheBlock
Notably, amid the surge in LINK’s whale activity, its value has plunged by 37% during the period under review.
The uptick in LINK’s exchange inflows during the same period suggests that these whales have gradually sold their holdings, hence the continued price decline. In the past 30 days, LINK’s inflow volume has risen by 29%.
Read More: How To Buy Chainlink (LINK) and Everything You Need To Know
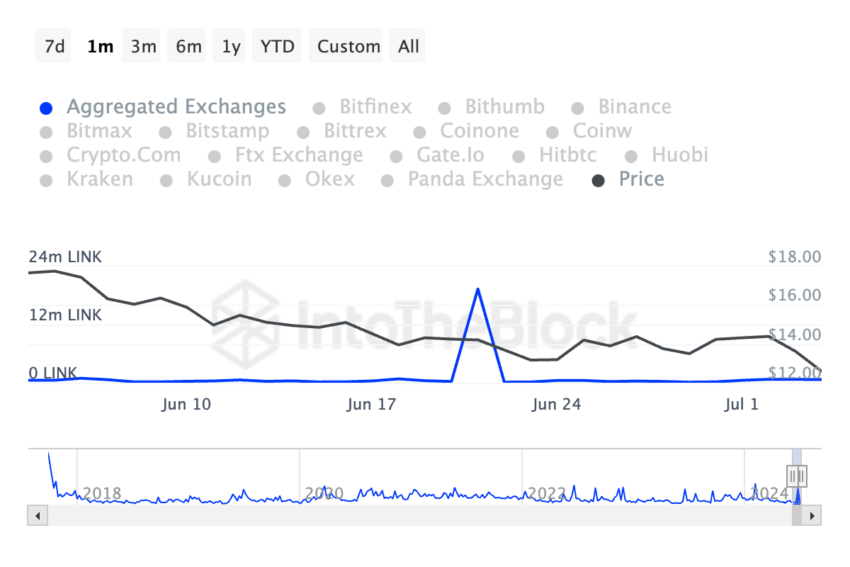 Chainlink Inflow Volume. Source: IntoTheBlock
When an asset’s inflow volume spikes, it indicates that a significant amount of the asset is being transferred into exchanges for onward sales. It is a known bearish signal.
LINK Price Prediction: Liquidity Exit Puts Token At RiskAs observed on a one-day chart, LINK’s Chaikin Money Flow (CMF) currently trends downward and is positioned below the zero line at -0.23.
This indicator measures how money flows into and out of an asset. When its value is negative, it is a sign of market weakness. It suggests that people are removing their capital from the market, thereby contributing to the price decline.
If this trend continues, LINK’s price may plummet to $11.11, a low last observed in November 2023.
 Chainlink Analysis. Source: TradingView
However, if market sentiment shifts from bearish to bullish, the token’s price might climb to $13.02.
The post Chainlink (LINK) Witnesses Decline Amid Hike in Daily Transactions appeared first on BeInCrypto.