Celestia (TIA) 27% Decline Leaves It Oversold, Setting Stage for Rebound
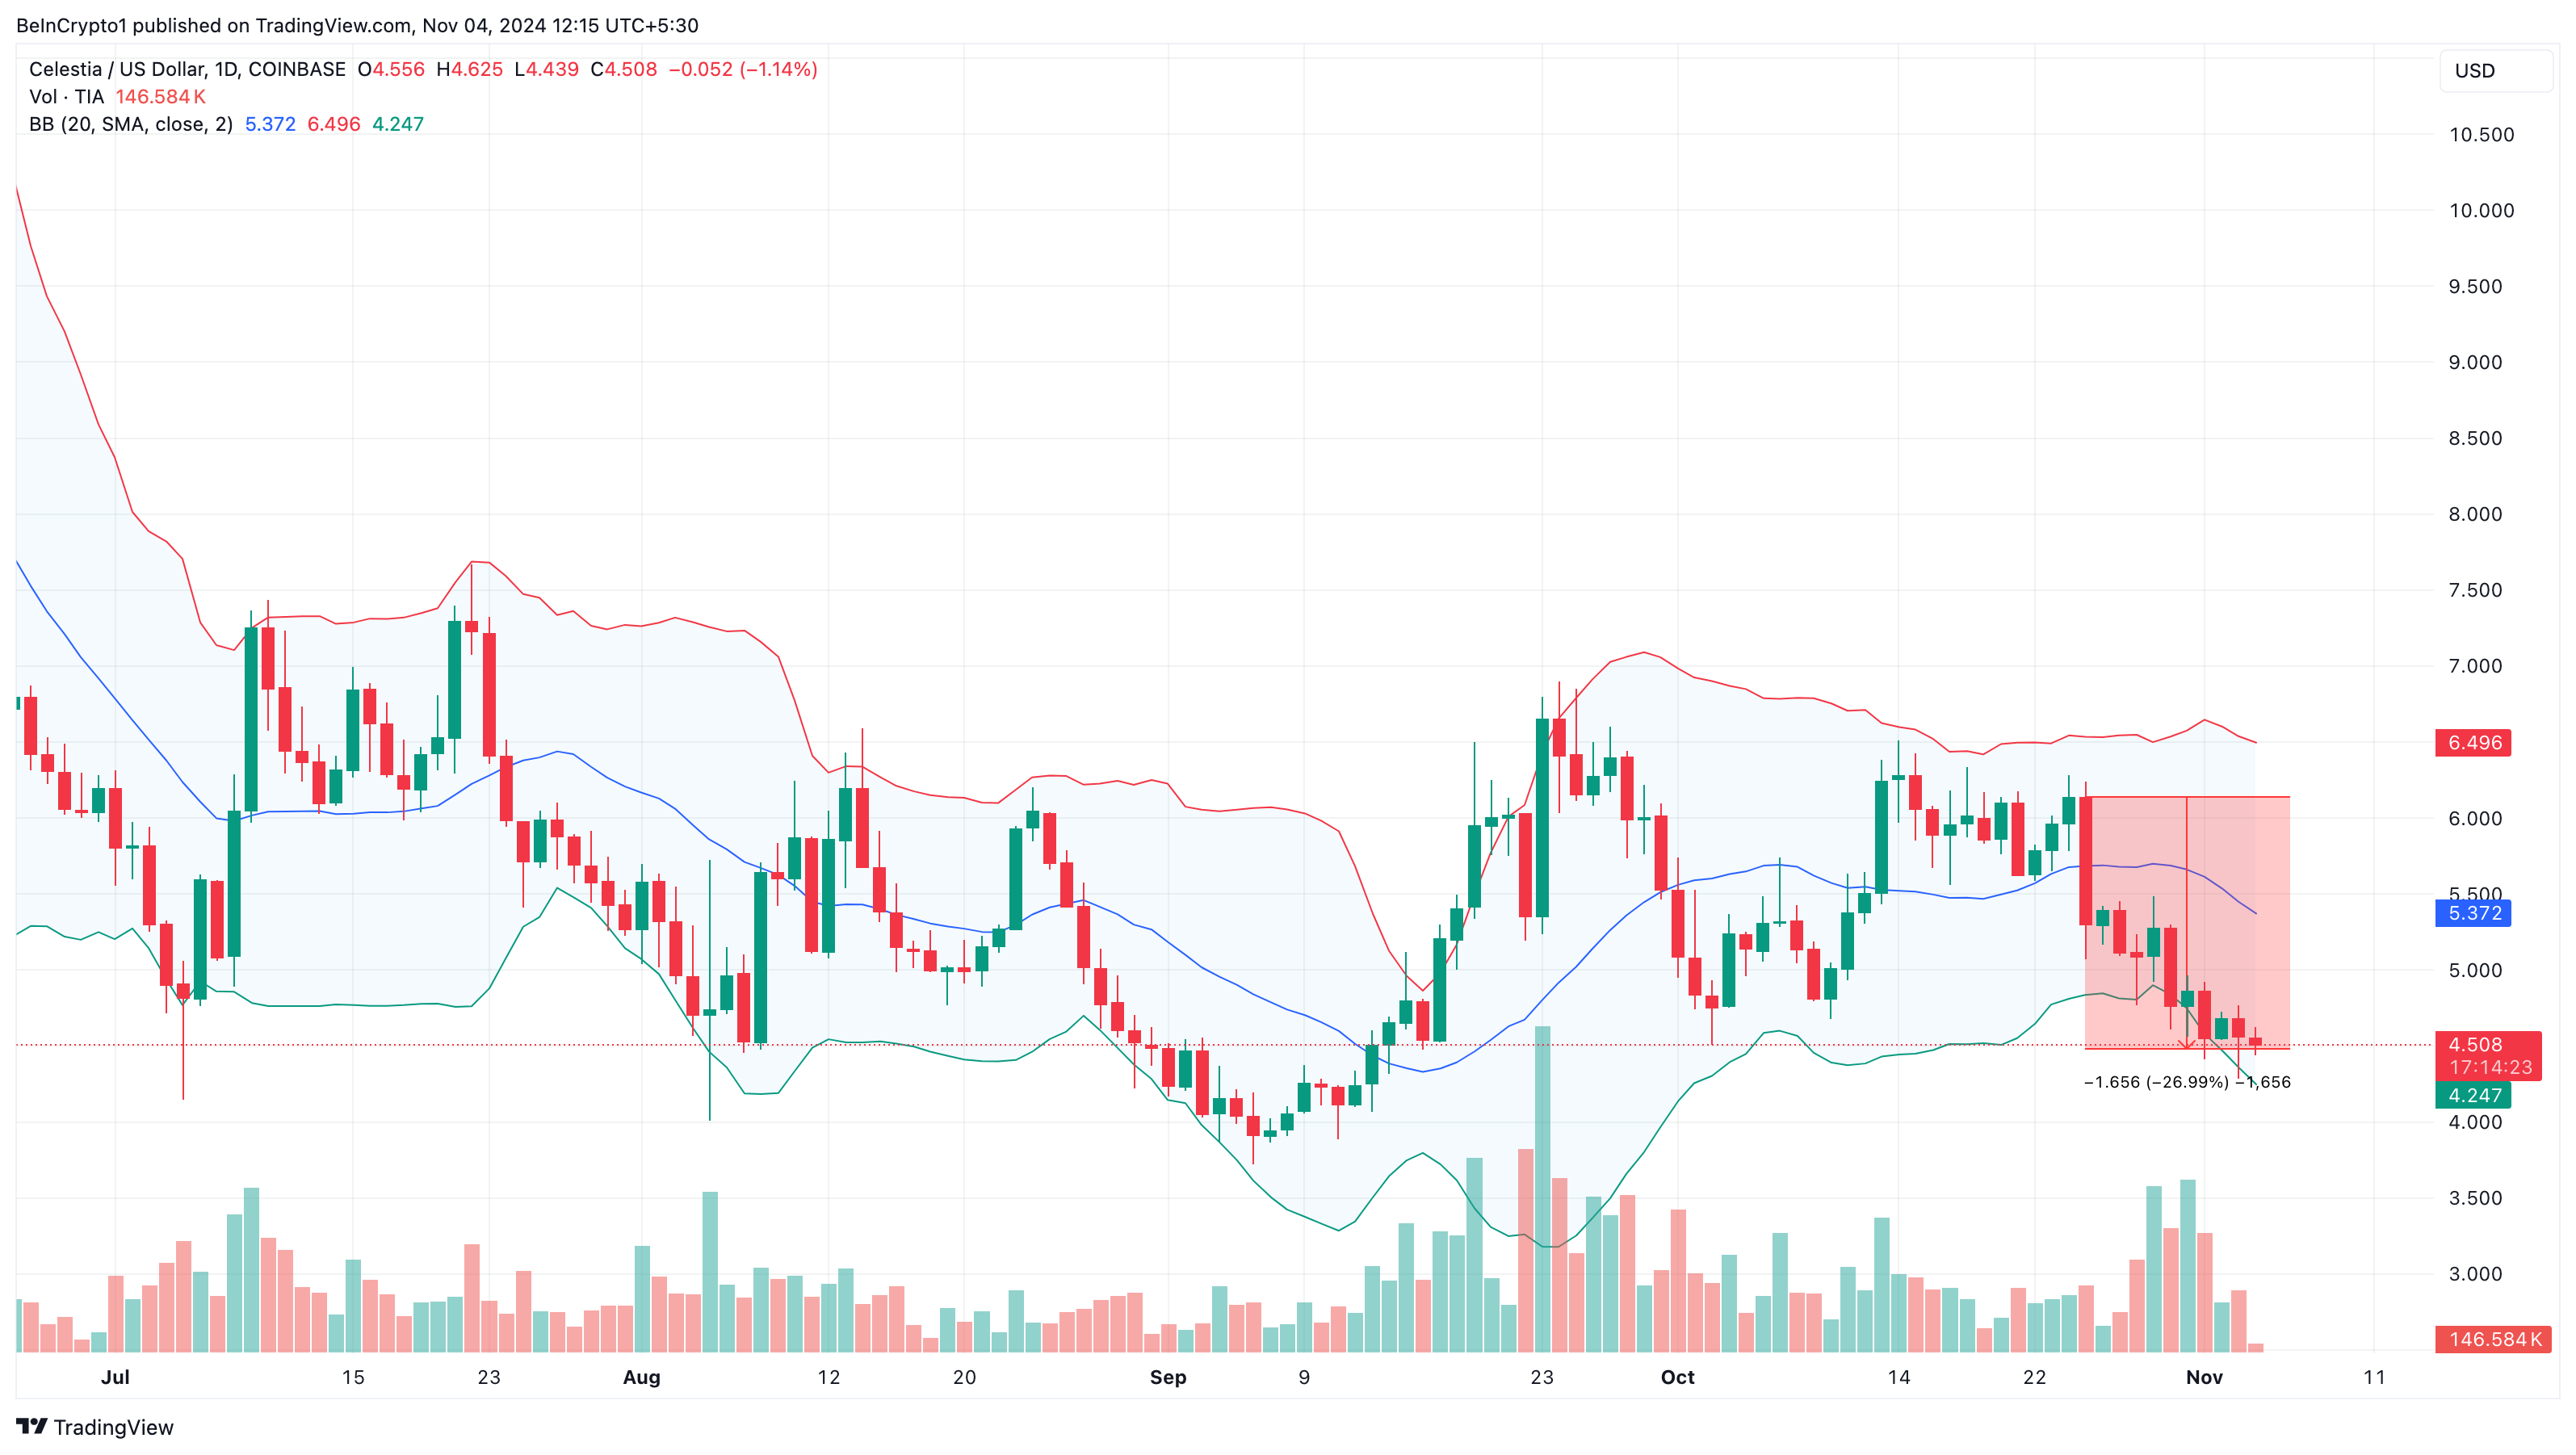
Celestia’s (TIA) price has decreased by approximately 27% since October 25. During that period, the altcoin fell from $6.16 to $4.50, erasing all the gains TIA had in September.
However, recent analysis reveals that the token could soon begin to recover. Here are the reasons and likely targets in the short term.
Celestia Volatility Drops, Token OversoldCelestia price decrease could be linked to several factors, including rising selling pressure and the broader market condition. But notably, the recent token unlock, which drove supply to a much higher level than demand, was the major culprit.
Meanwhile, the daily chart reveals a slight contraction in the Bollinger Bands (BB) compared to recent days. The BB is a technical indicator that tracks volatility levels around a cryptocurrency, providing insights into potential price movement.
When the Bollinger Bands expand, they signal high volatility, meaning the price could move fast in either direction depending on market pressure. However, the recent slowdown in their expansion indicates that TIA’s decline may not continue to accelerate.
Read more: What is a Layer-1 Blockchain?
 Celestia Bollinger Bands. Source: TradingView
Further, the Bollinger Bands actively indicates whether an asset is overbought or oversold. When the price touches the upper band, the asset is considered overbought. In TIA’s case, the price has touched the lower band, signaling it is oversold and may soon reverse upward.
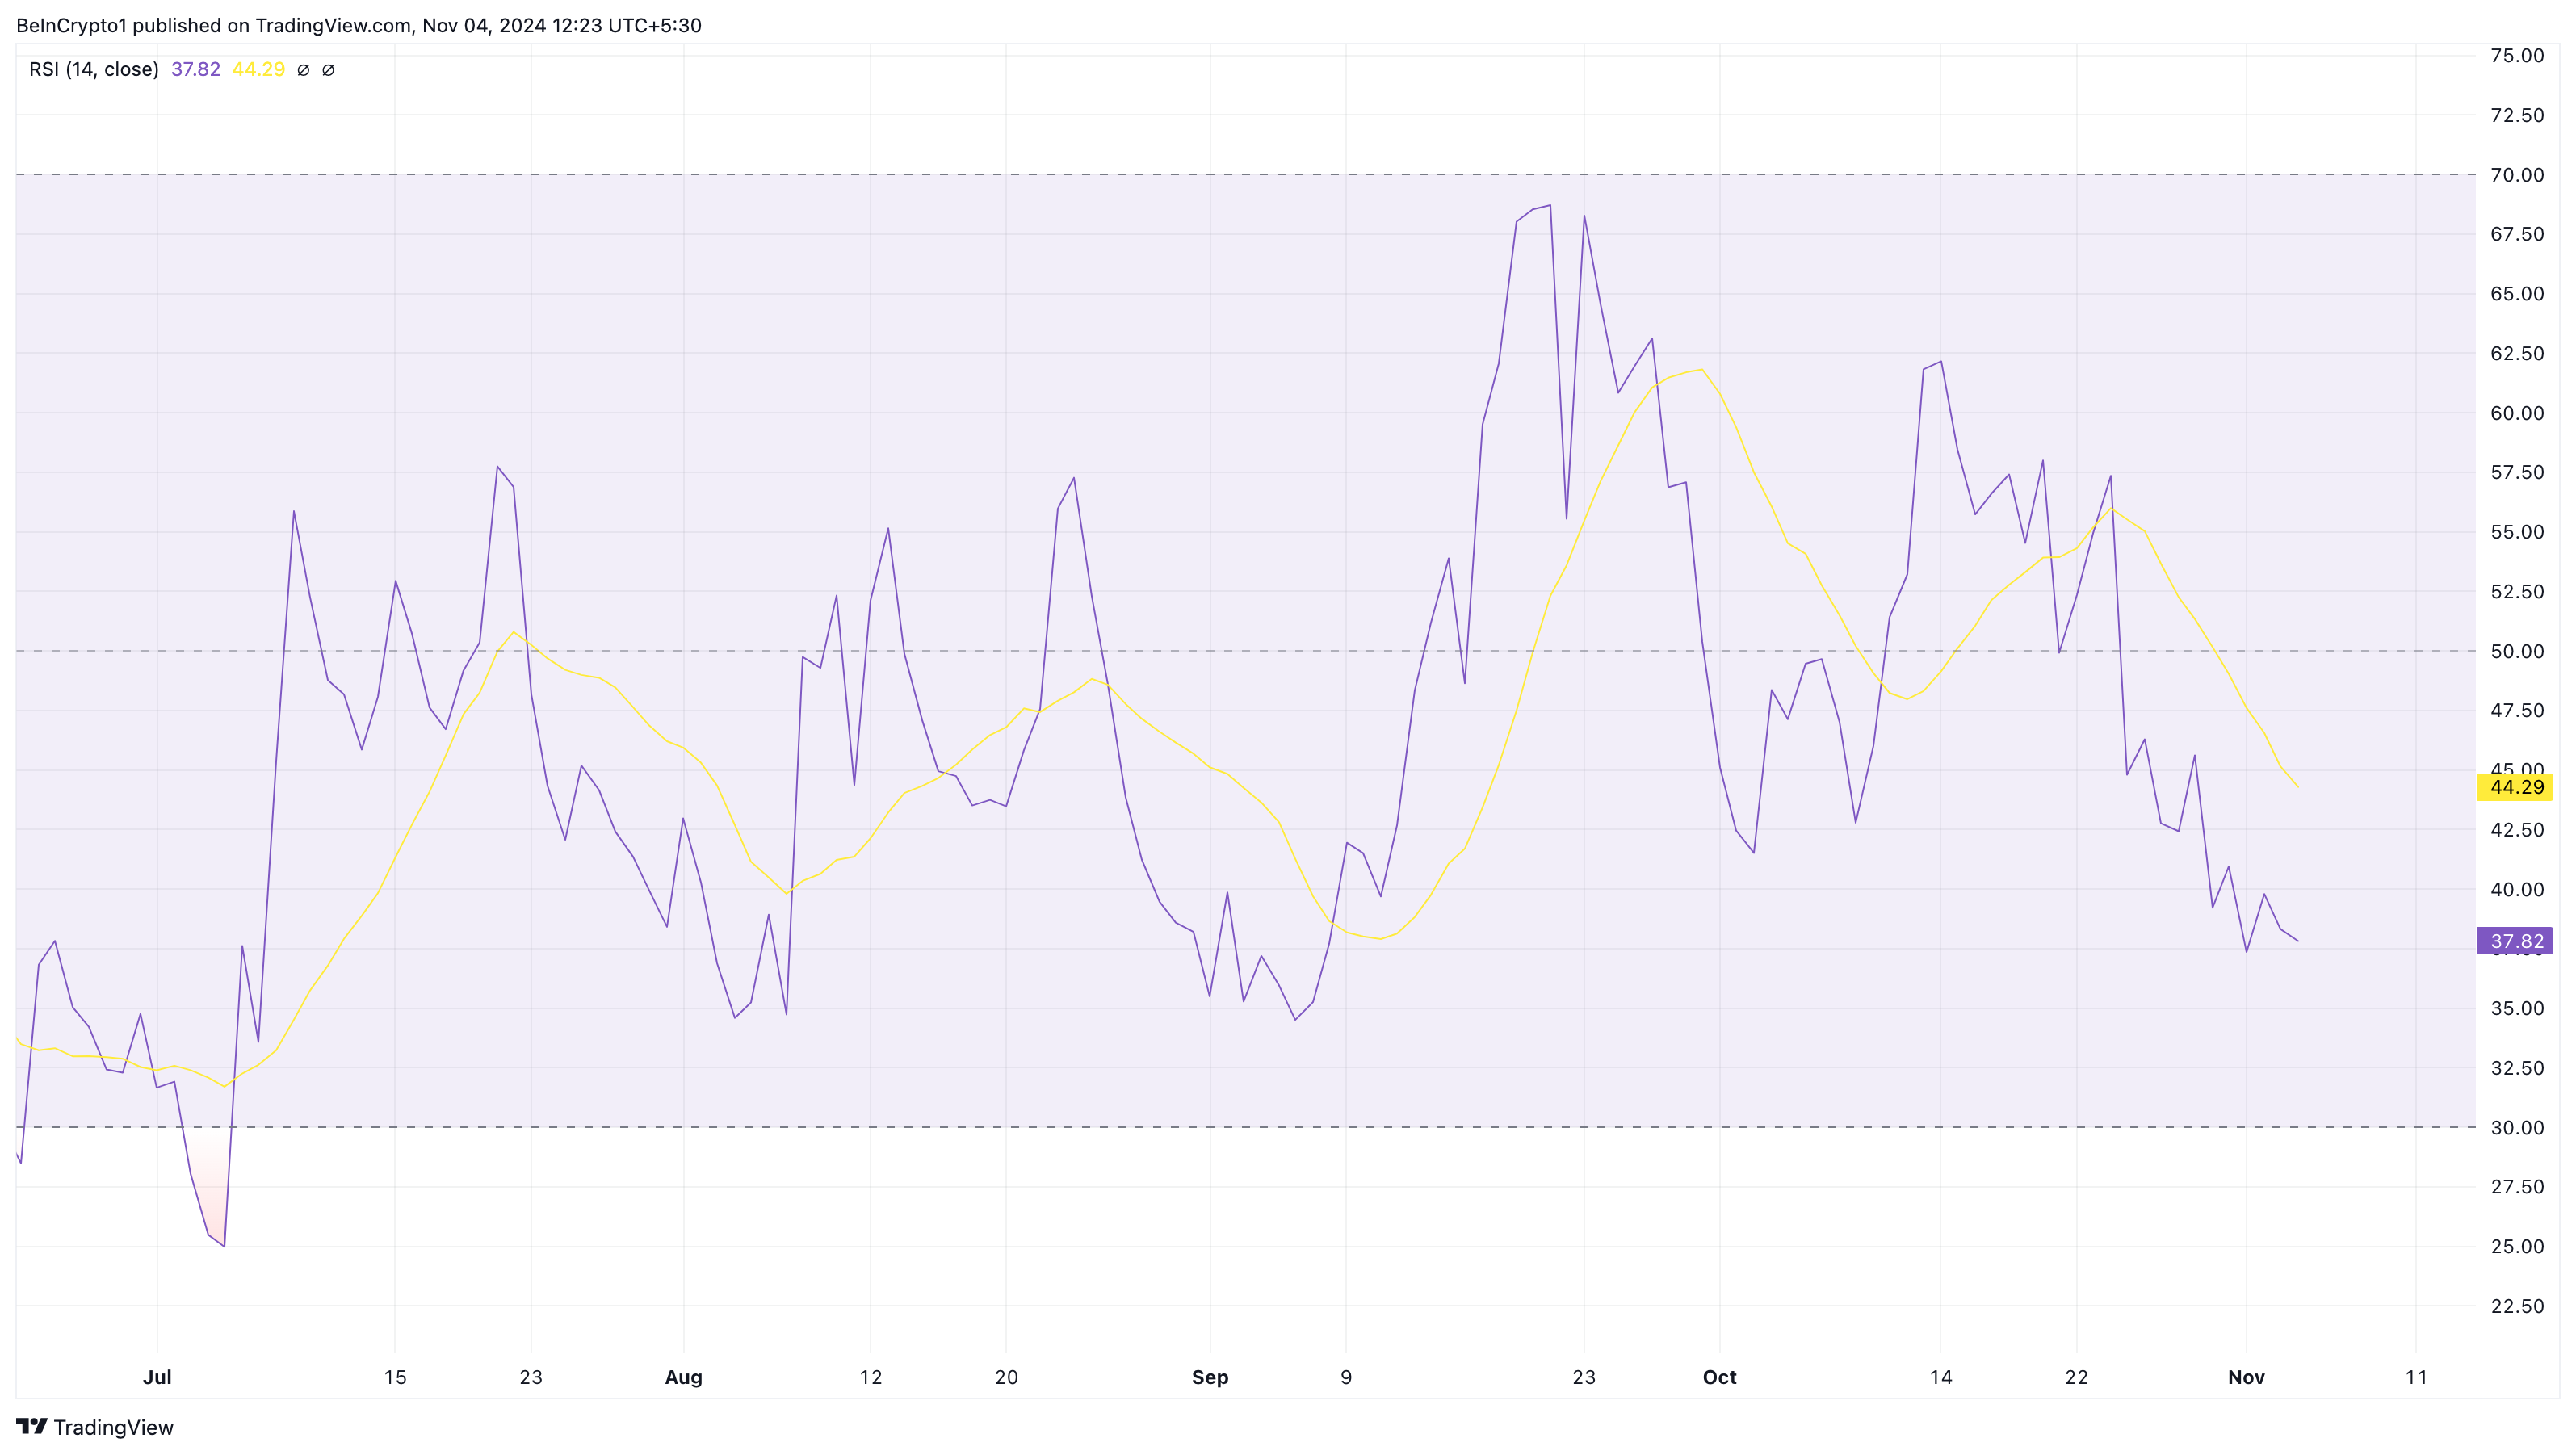
The Relative Strength Index (RSI), a momentum-based technical oscillator like the BB, also supports this view. It gauges whether an asset is overbought or oversold.
A reading below 30.00 indicates an oversold condition, while a reading above 70.00 signals an overbought state. On the TIA/USD daily chart, the RSI stands at 37.81. Although it is not in oversold territory yet, a further decline could confirm this position.
 Celestia Relative Strength Index. Source: TradingView
TIA Price Prediction: Bullish Reversal Imminent
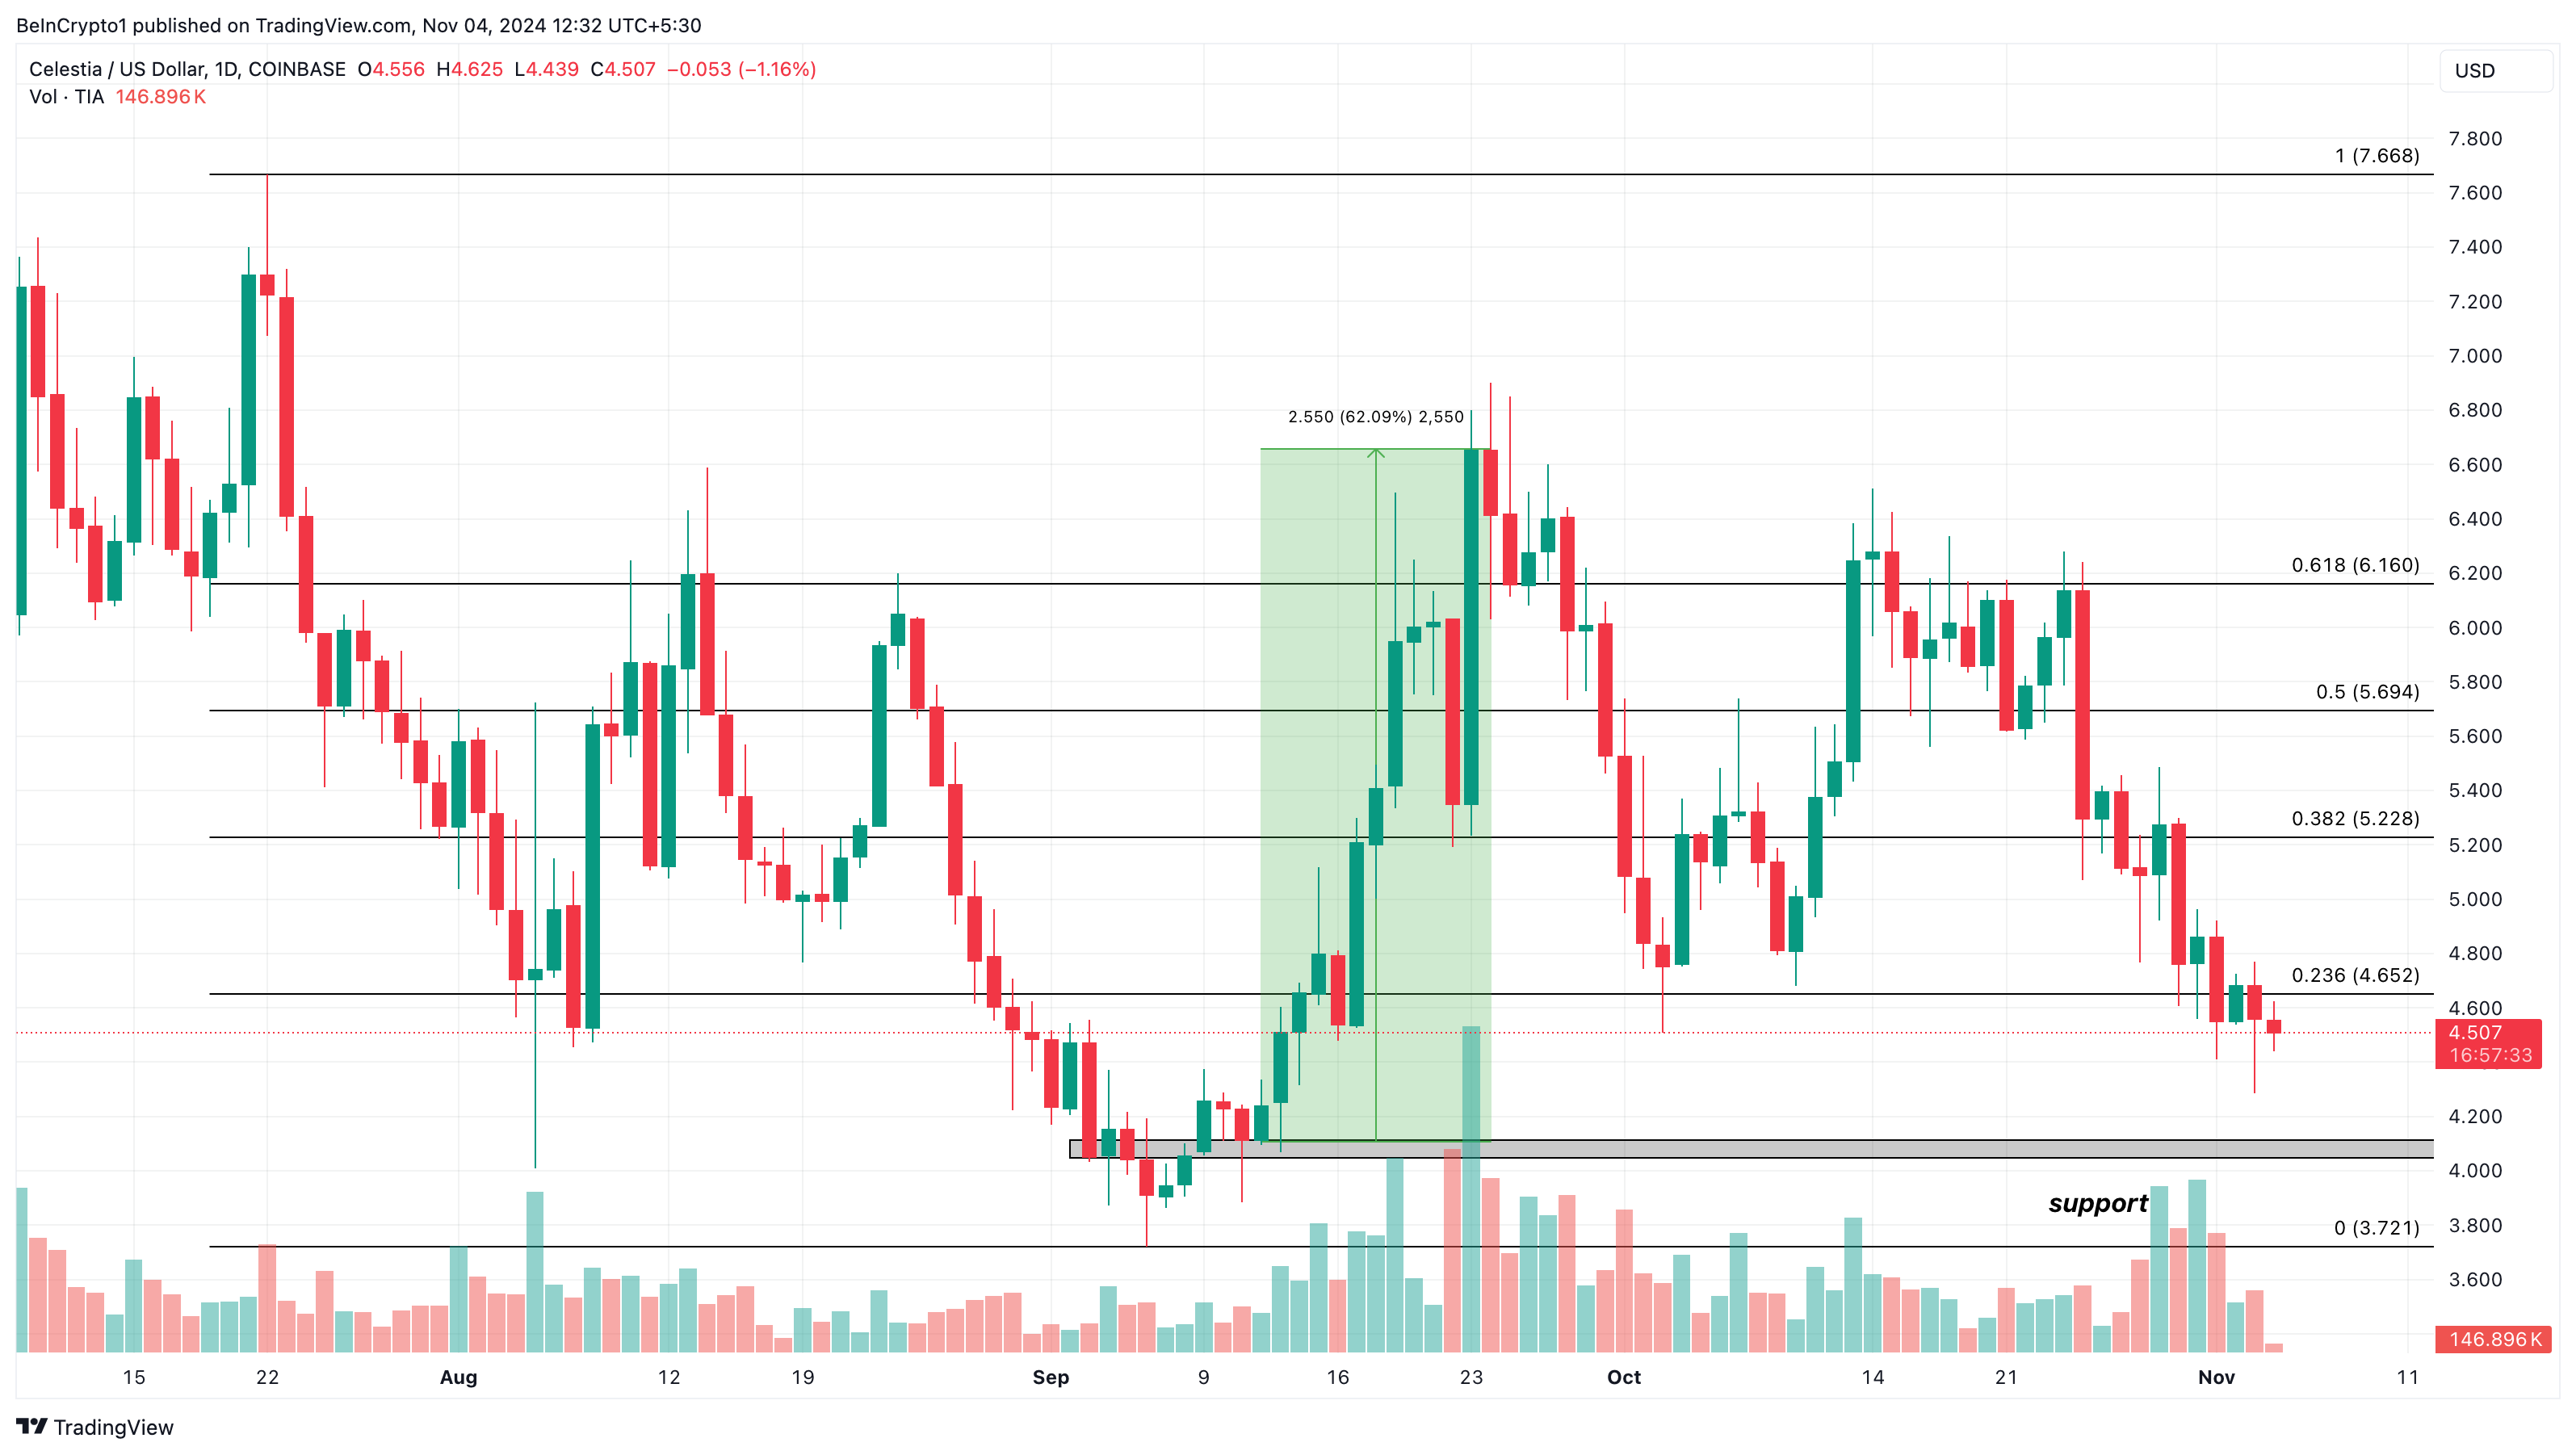
Meanwhile, Celestia’s crypto price might continue its downtrend. The chart suggests that TIA could drop below $4.20. However, strong support at $4.12 could trigger a significant rebound for the altcoin.
As shown below, this same support level was what drove TIA’s price to a 62% hike in September. That is not to say that the token will replicate such performance. However, it is likely to climb to $5.23 within a few weeks if bulls defend the underlying support.
Read more: 12 Best Altcoin Exchanges for Crypto Trading in November 2024
 Celestia Daily Analysis. Source: TradingView
Conversely, failing to hold Celestia above this critical support could negate that forecast. If this happens, TIA could decline further to $3.72.
The post Celestia (TIA) 27% Decline Leaves It Oversold, Setting Stage for Rebound appeared first on BeInCrypto.
