BNB Price on Track to Stay Above $500
Despite recent volatility, Binance Coin (BNB) appears to be showing resilience, with its price holding above $500 since September 11 and currently trading at $552.
With growing market attention, this analysis explores why BNB may aim for a higher value in the near term.
Binance Coin Momentum Becomes BullishBased on the daily chart, Binance Coin’s (BNB) Moving Average Convergence Divergence (MACD) indicator is currently in the positive region. The MACD measures momentum by evaluating the relationship between the 12-day EMA (blue) and the 26-day EMA (orange) to identify potential trend reversals.
Typically, when the 26-day EMA crosses above the 12-day EMA and the MACD reading turns negative, sellers gain control, and momentum becomes bearish, often leading to a price decline. Historically, such scenarios have led to BNB erasing some of its previous gains.
However, in the present case, the 12-day EMA has crossed above the 26-day EMA, indicating that buyers are currently dominant. This crossover suggests that upward momentum is building, and BNB’s price could rise further if the buying pressure continues.
Read more: BNB Crypto Storage: Best BNB Wallets to Consider in 2024
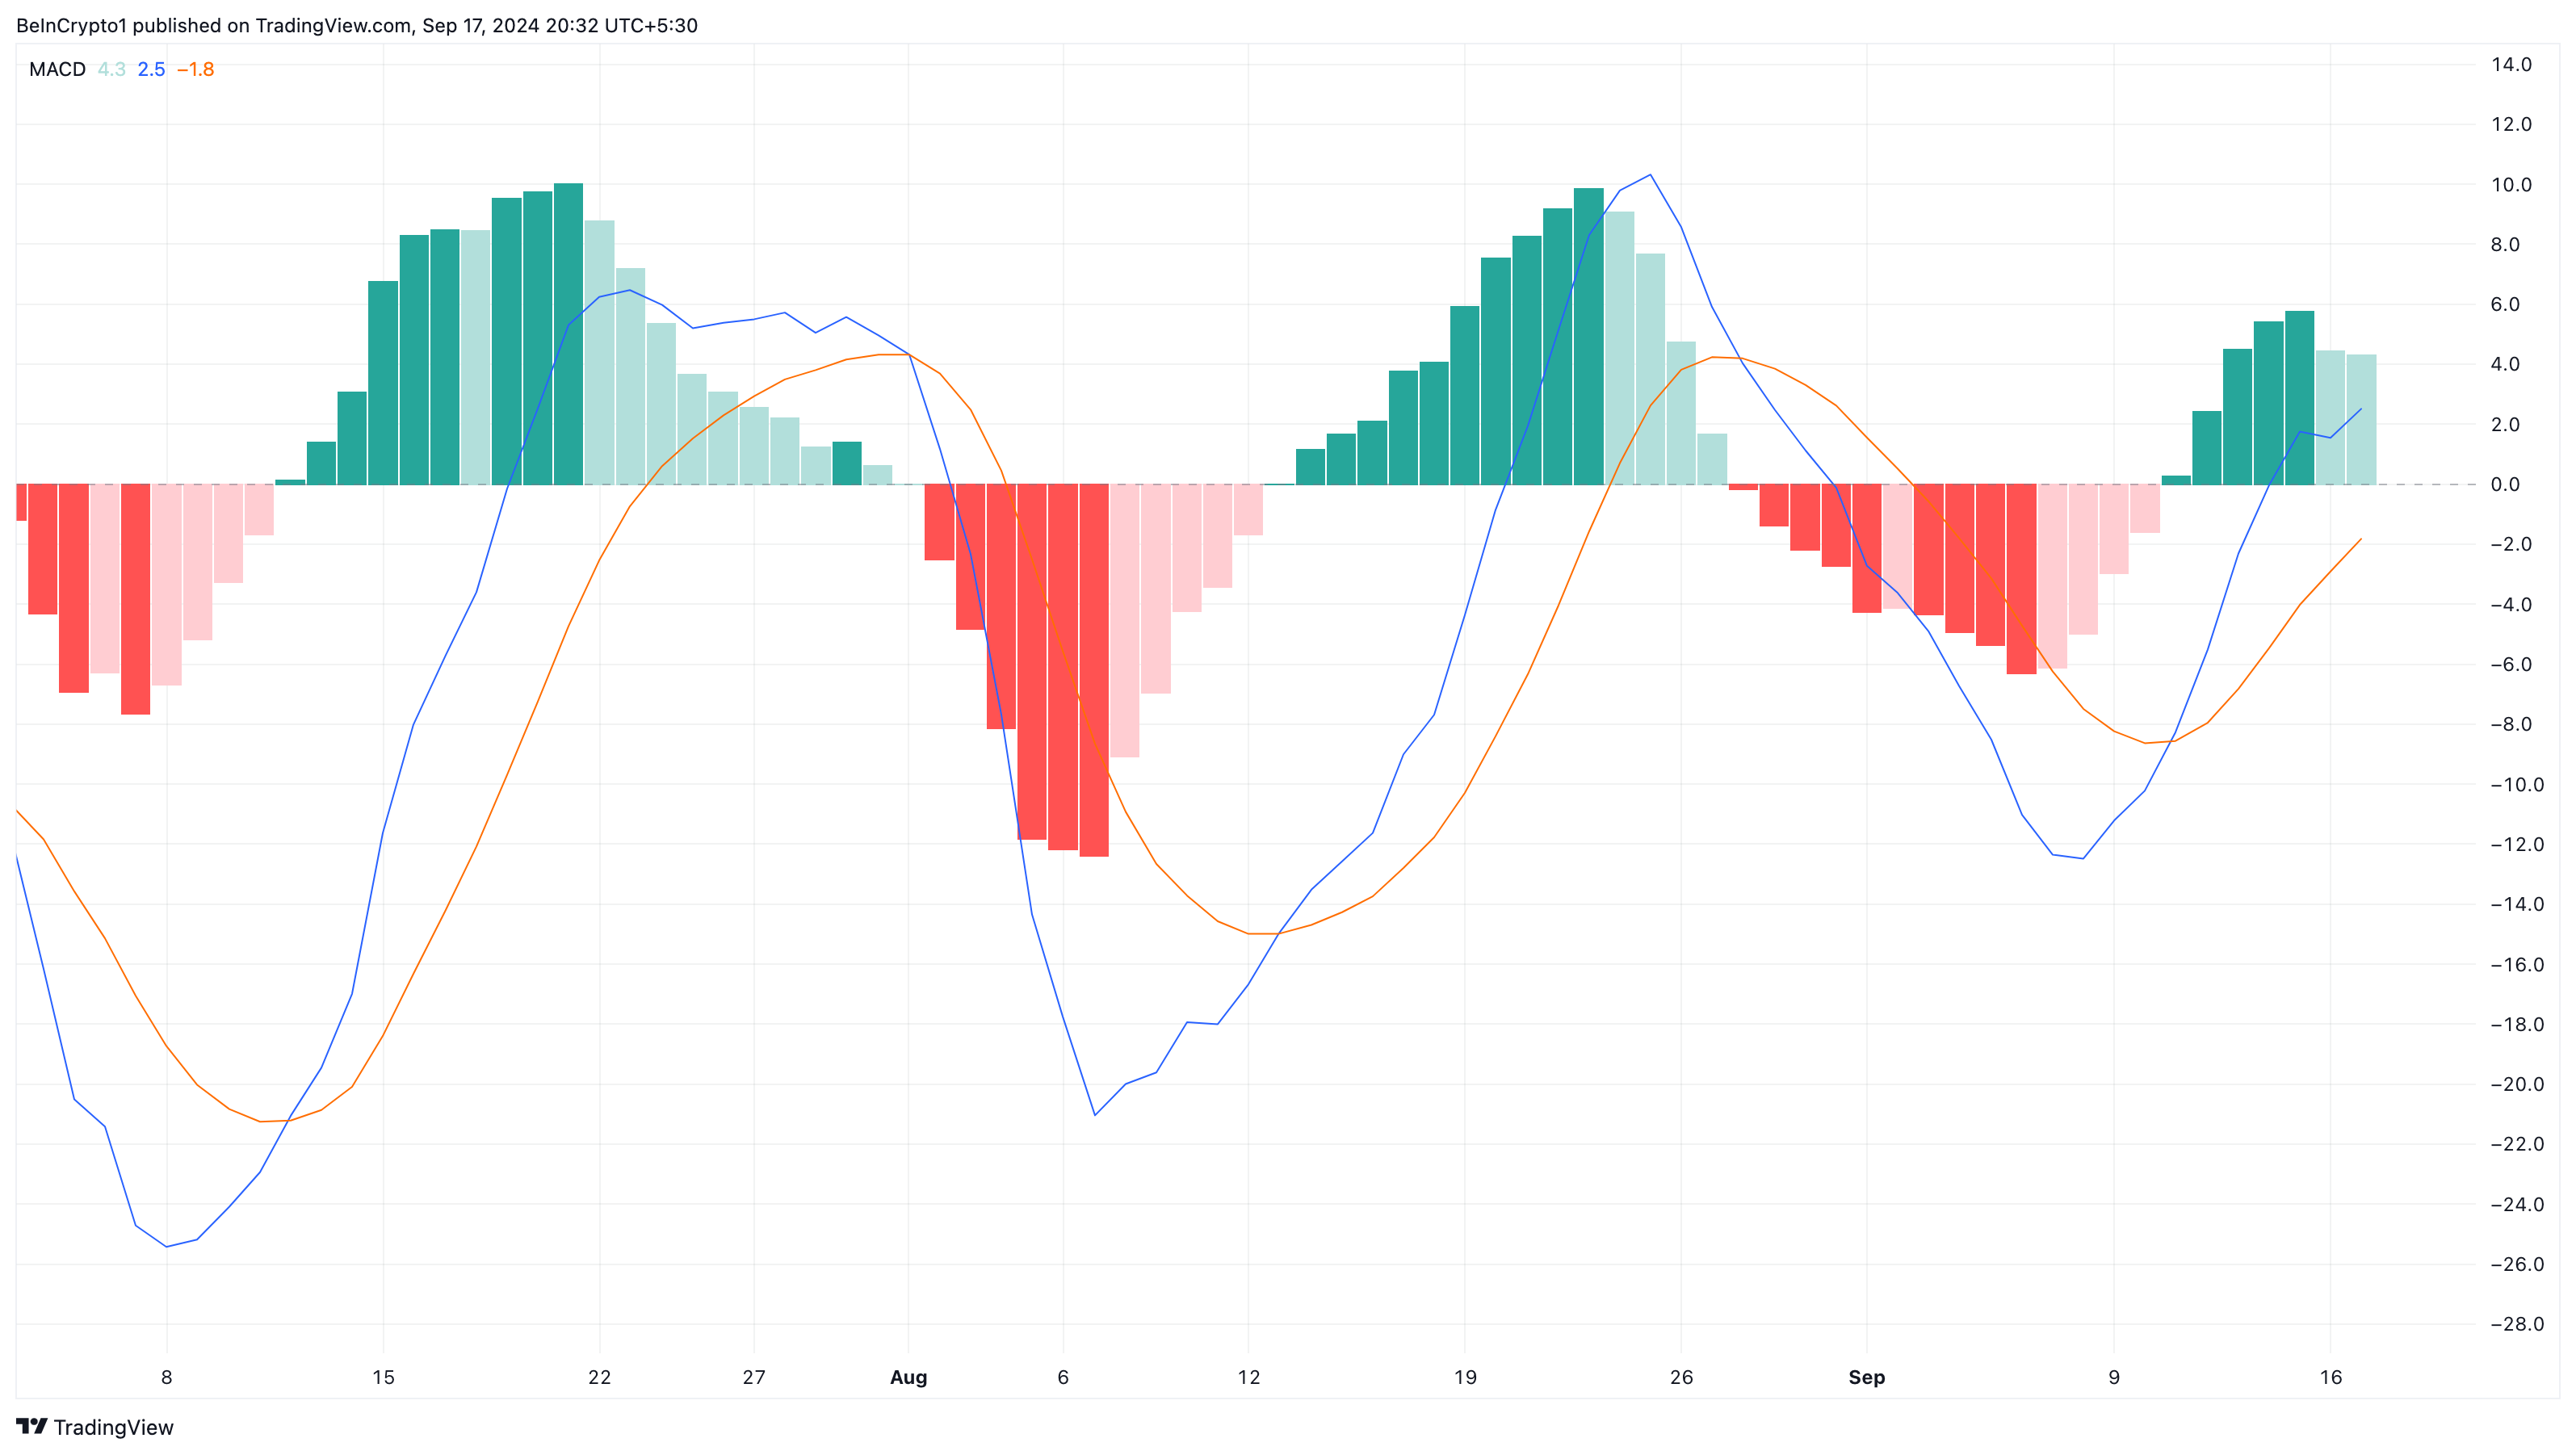 Binance Coin MACD. Source: TradingView
In addition to the MACD, the Chaikin Money Flow (CMF) indicator also supports a bullish outlook. The CMF measures the rate of accumulation or distribution over a given timeframe. When the CMF rises above the zero line, it suggests that accumulation —buying pressure — is stronger than distribution, signaling bullish momentum.
Currently, the CMF on the BNB/USD daily chart has moved above the zero line, indicating that bulls are working to push the cryptocurrency toward higher values.
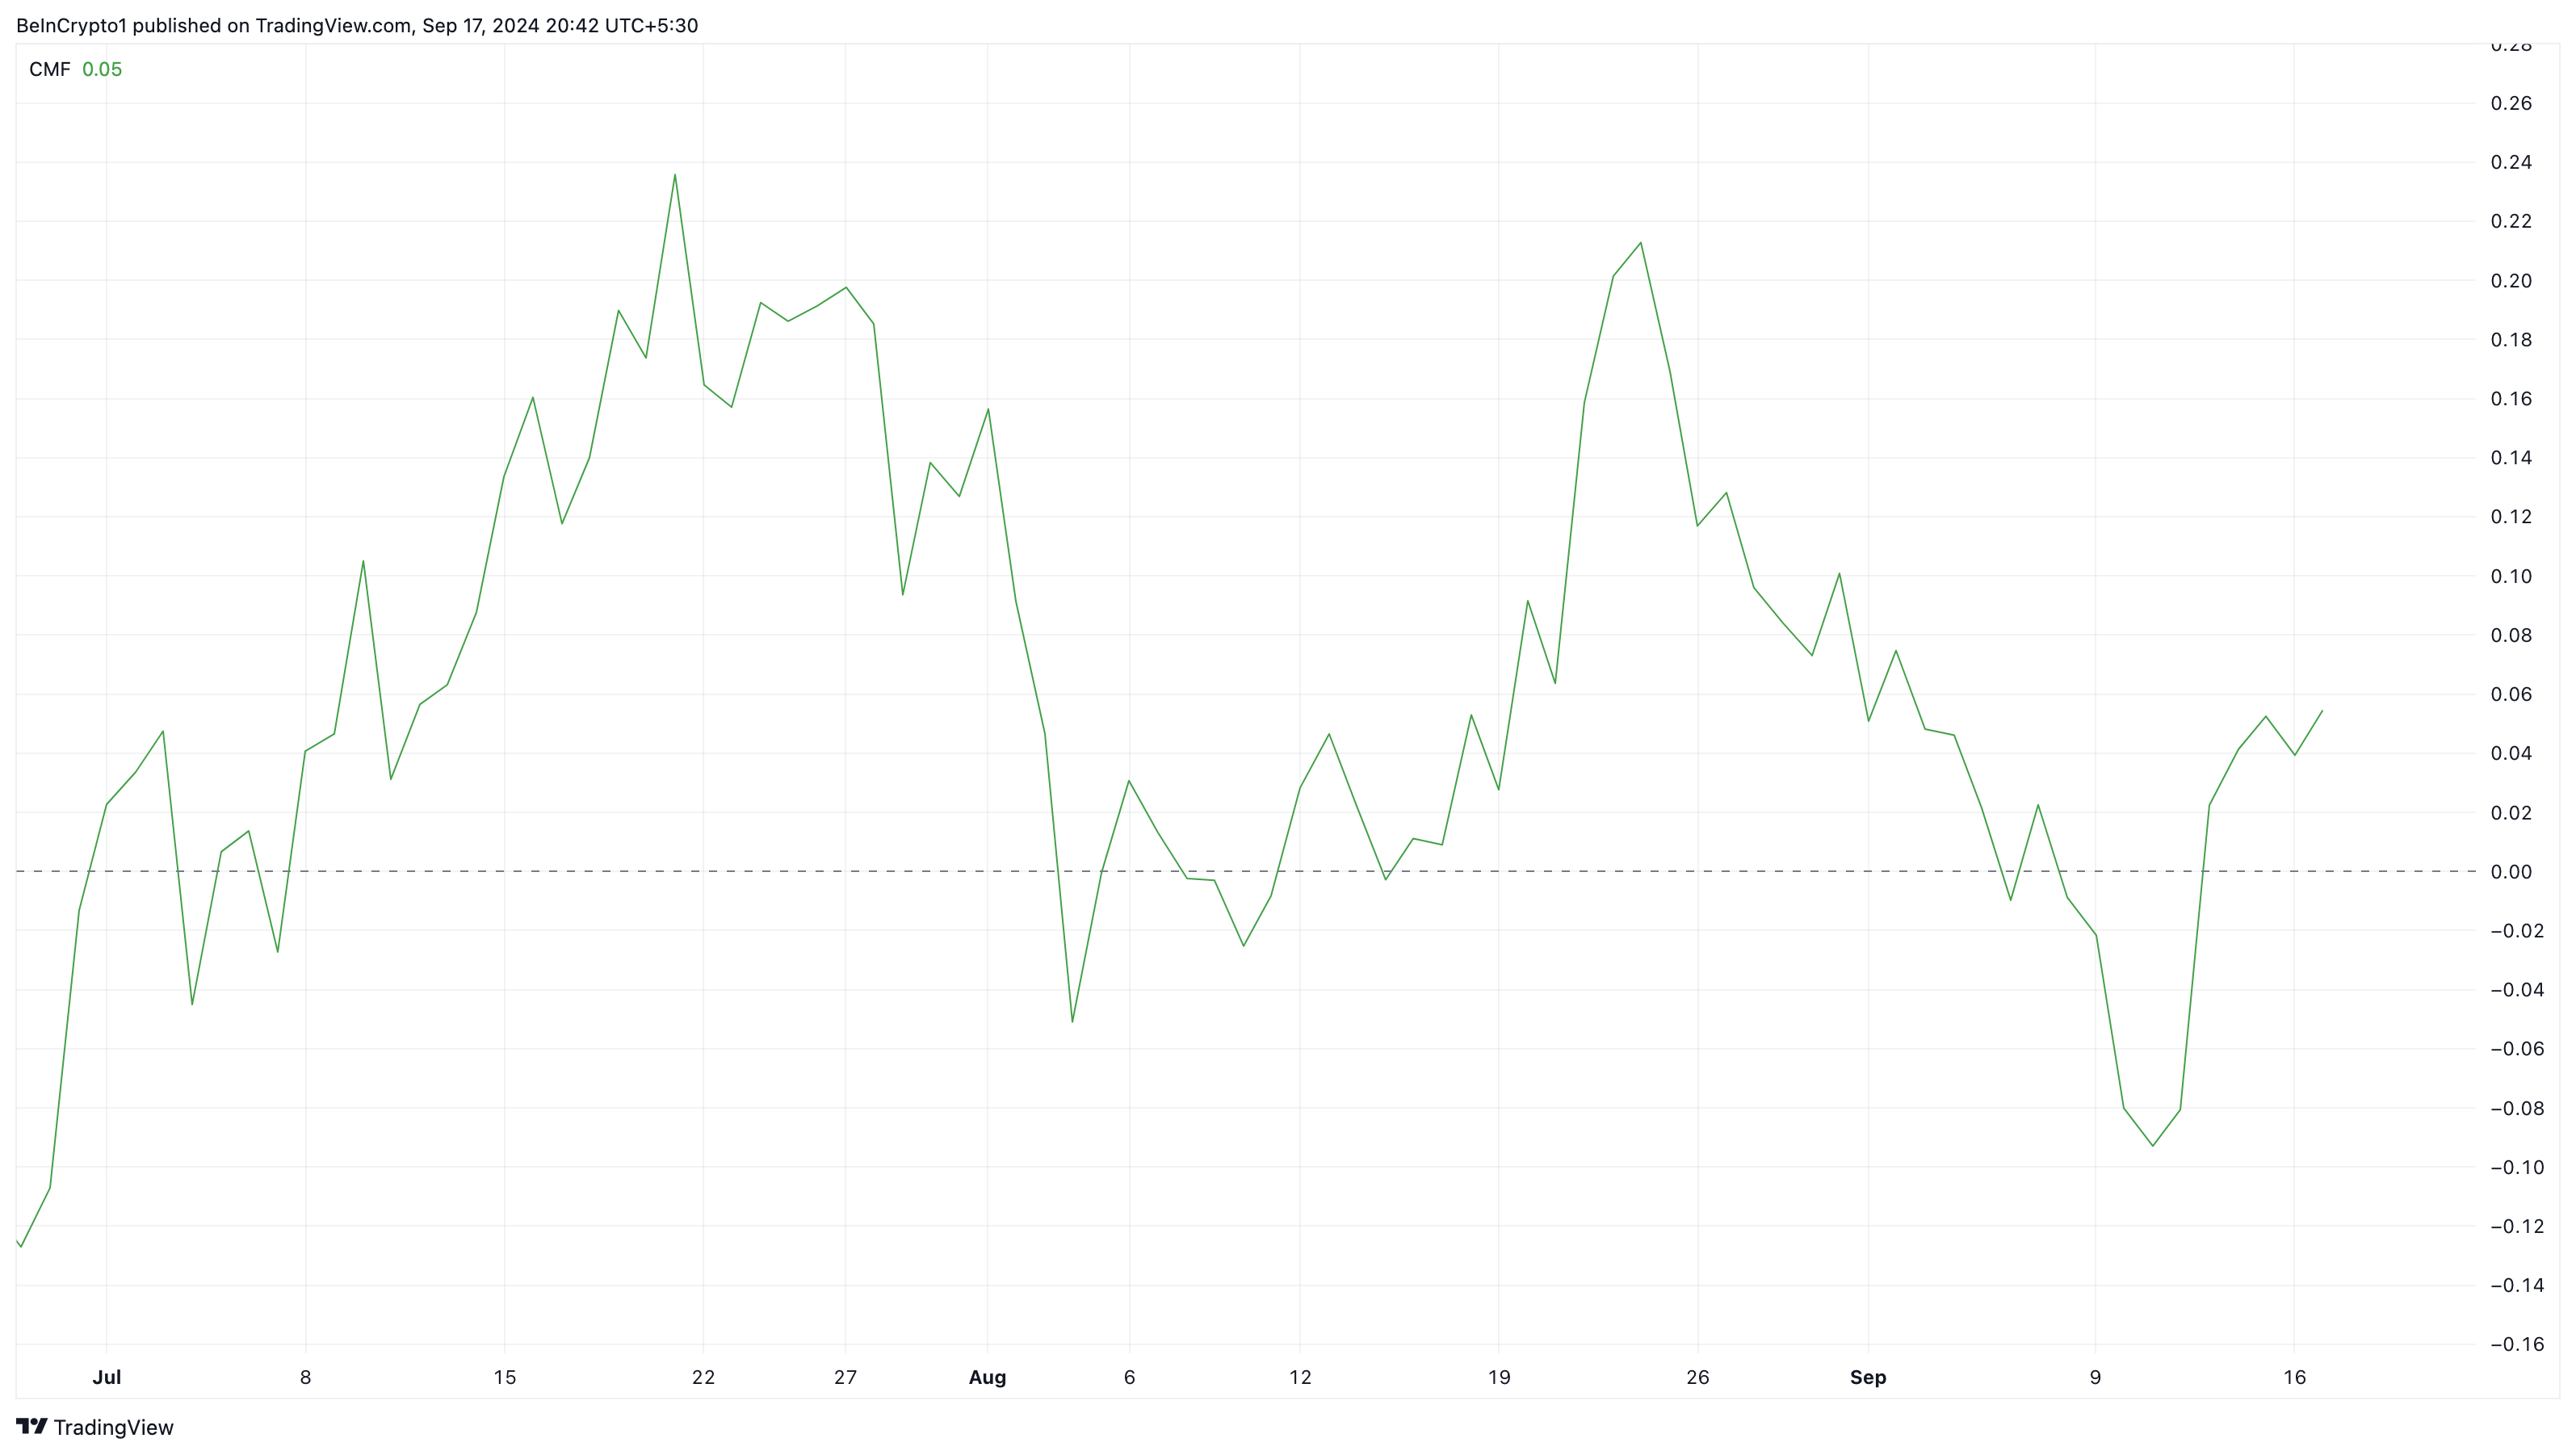 Binance Coin Daily Analysis. Source: TradingView
BNB Price Prediction: The Run to $625 Begins
Binance Coin Daily Analysis. Source: TradingView
BNB Price Prediction: The Run to $625 Begins
On the same daily chart, BeInCrypto noticed the formation of a falling wedge — a bullish technical pattern. Typically, the wedge appears after prices on the swing highs hit lower values, and those on the swing lows do the same.
However, as the trendlines converge, sellers begin to lose momentum, and buyers capitalize on the fatigue. Once buying pressure increases, BNB’s price could rise higher than its current position.
By the look of things, the coin seems almost certain to break the resistance at $574.60. For this to happen, bulls must defend the $517.50 support level. If successful, BNB could climb as high as $625 in the short term.
Read more: Binance Coin (BNB) Price Prediction 2024/2025/2030
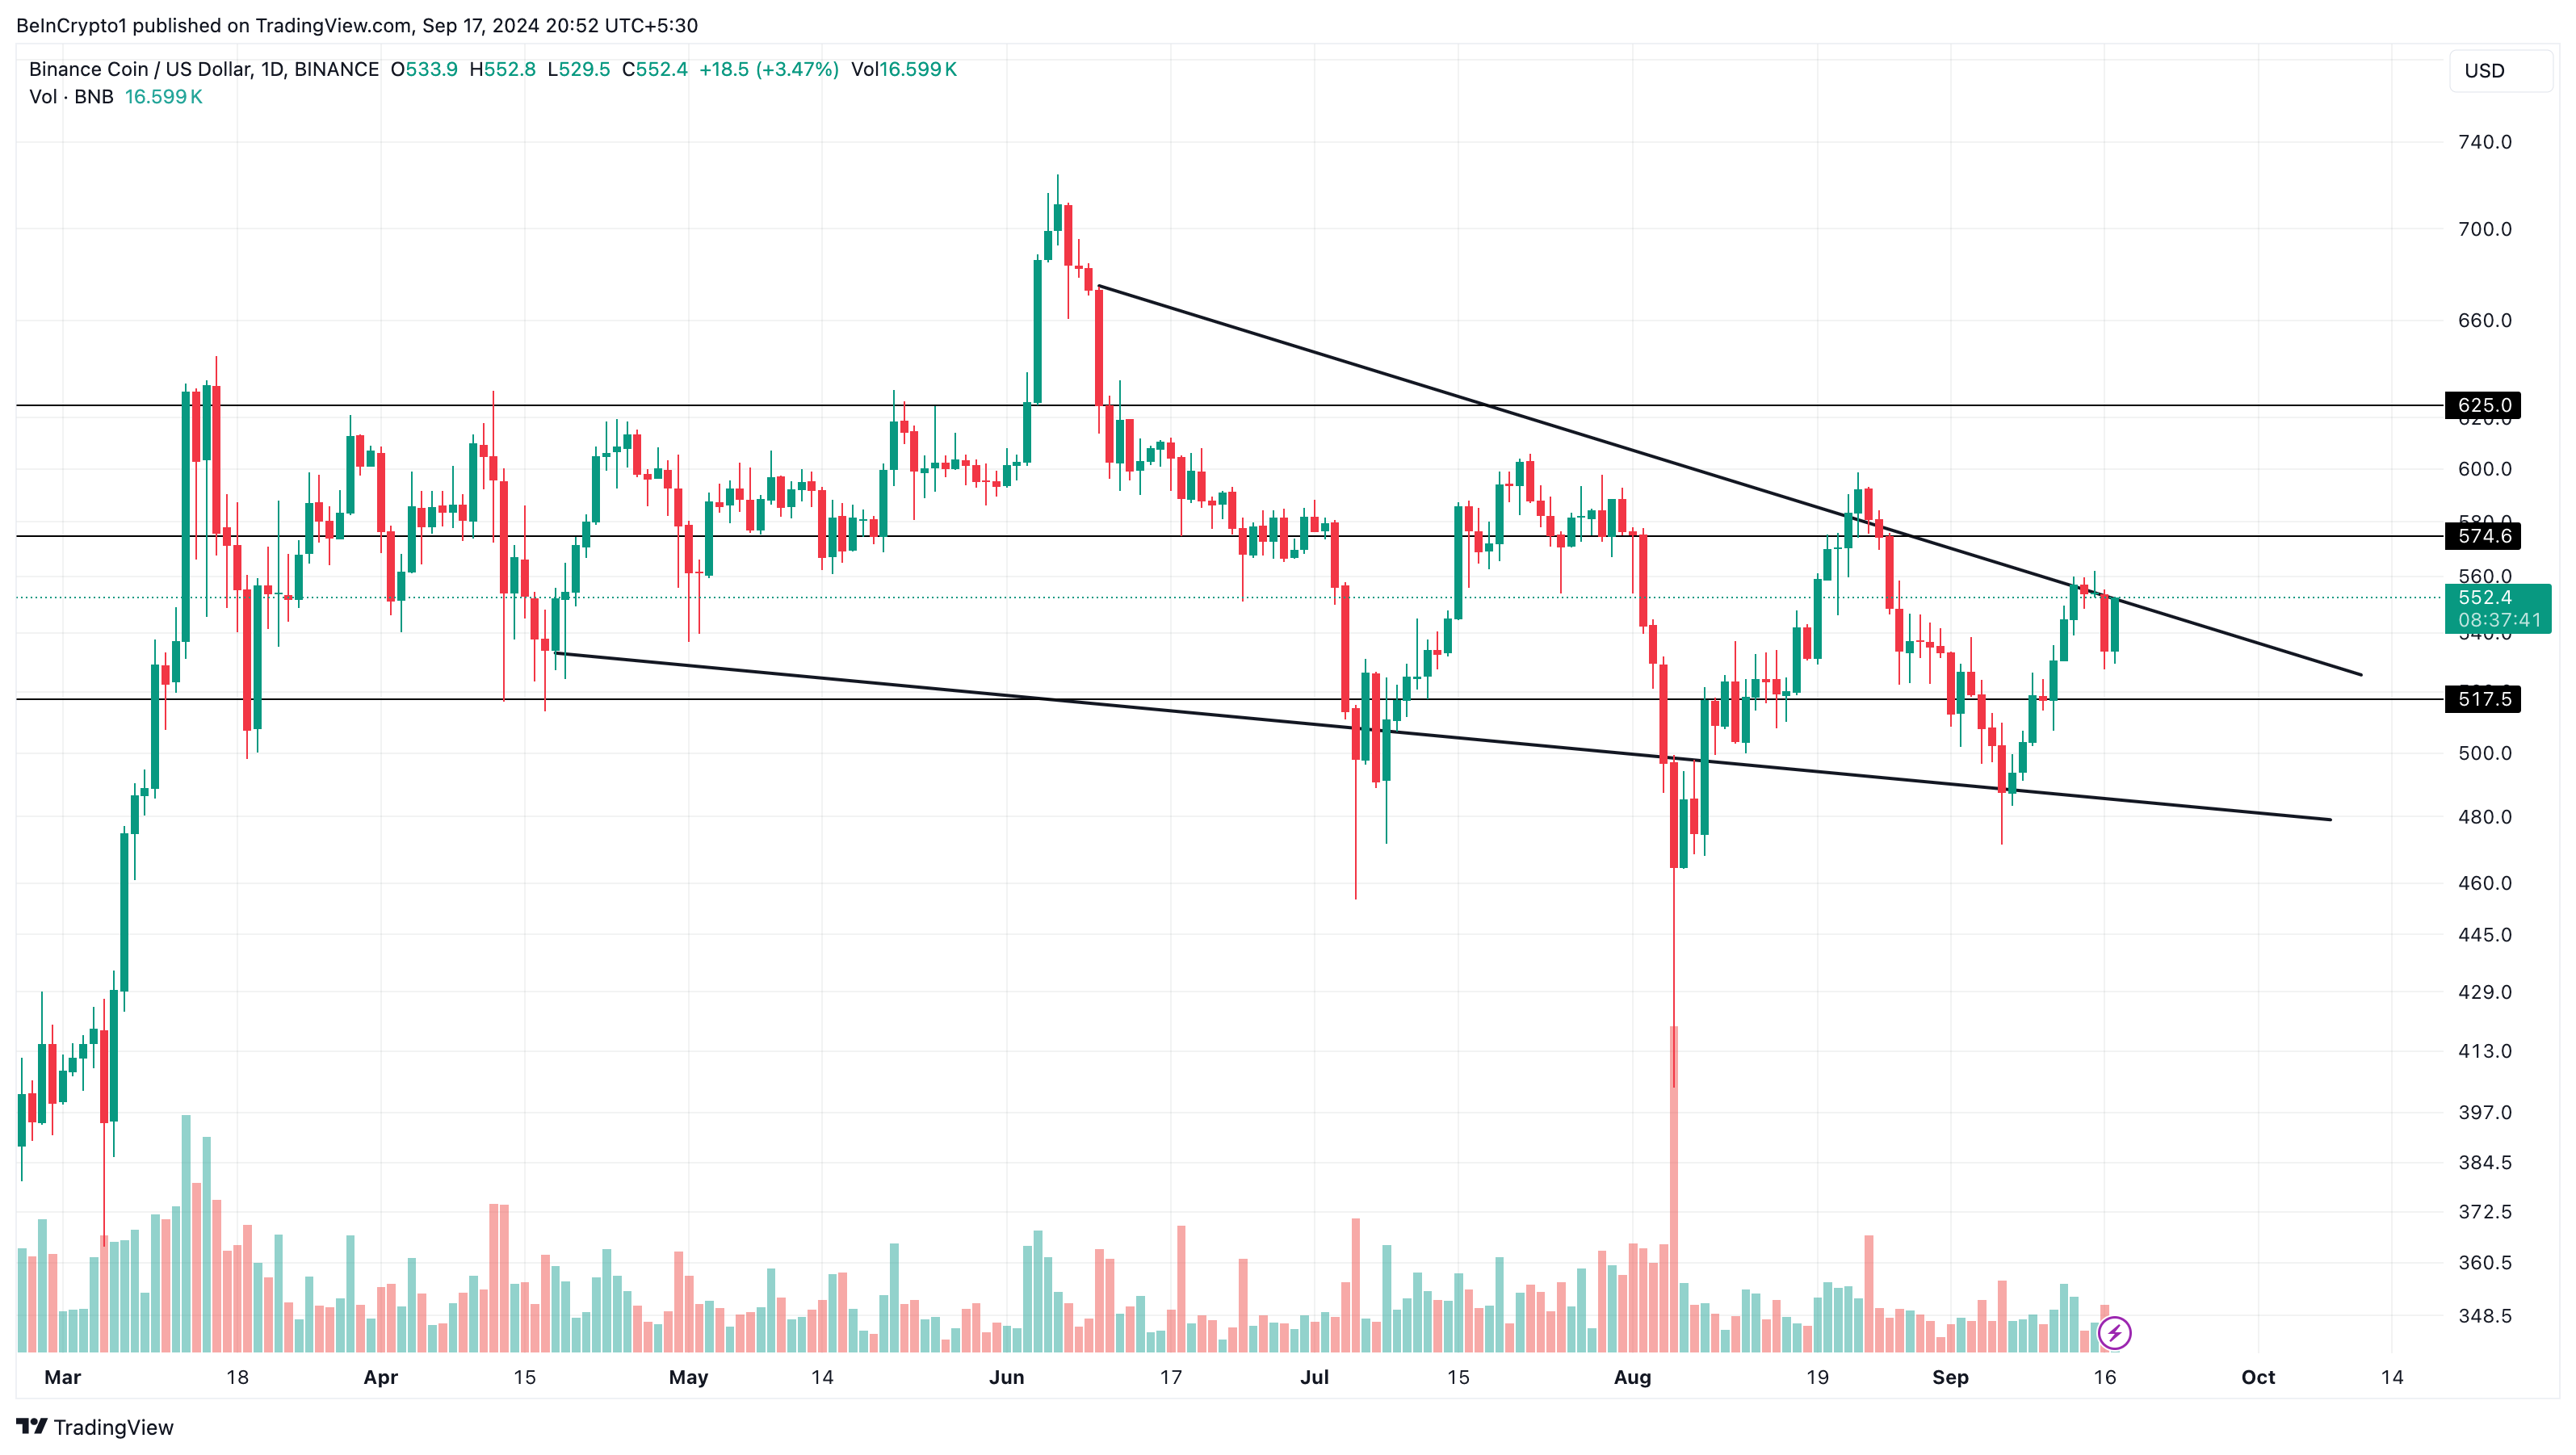 Binance Coin Daily Analysis. Source: TradingView
However, the forecast might be invalidated if BNB fails to break above the resistance. In that scenario, the coin might drop below the $517.50 support.
The post BNB Price on Track to Stay Above $500 appeared first on BeInCrypto.