Bitcoin (BTC) On-Chain Dynamics Hint at Bullish Move: Key Factors
The current on-chain dynamics for Bitcoin are setting up a potentially bullish scenario.
Following last week’s insights, Bitcoin has shown strength, currently trading between $67,500 and $70,000 USD. Investors eagerly anticipate continuing this upward trend to reach a new all-time high. Let’s explore why this might happen.
This decrease in sell-side pressure, combined with modest but consistent capital inflows, suggests that the market is preparing for a significant upward move.
Bitcoin Technical OutlookBitcoin’s price has found support on the red descending trendline, indicating profit-taking. The price appears poised to test the daily Ichimoku cloud, which would be a major support level.
If the price breaks below the cloud, sentiment could shift to neutral, potentially causing Bitcoin’s price to trend toward $64,000 (Red Tenkan Line).
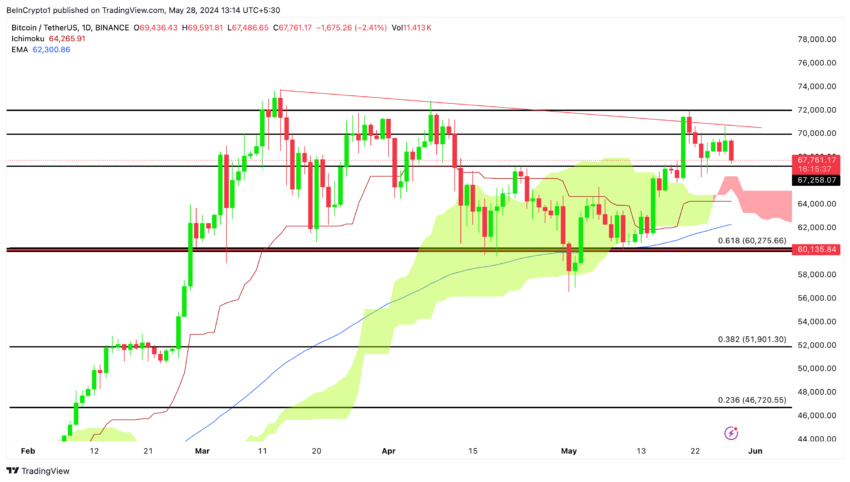 BTC/USDT (1D). Source: TradingView
Let’s Examine Some Key Bitcoin On-Chain Metrics
BTC/USDT (1D). Source: TradingView
Let’s Examine Some Key Bitcoin On-Chain Metrics
During Bitcoin bull markets, long-term holders usually sell some of their holdings as prices increase.
This pattern was evident from early 2024 to April, with significant declines in the supply last active for more than 1-year and 2-year cohorts. However, the supply held in UTXOs (unspent transaction outputs) for over 3 years continues to rise. Indicating a long-term bullish sentiment.
More than half of the total BTC supply hasn’t moved on-chain in over one year, reflecting strong holder conviction.
Read More: How To Get Paid in Bitcoin (BTC): Everything You Need To Know
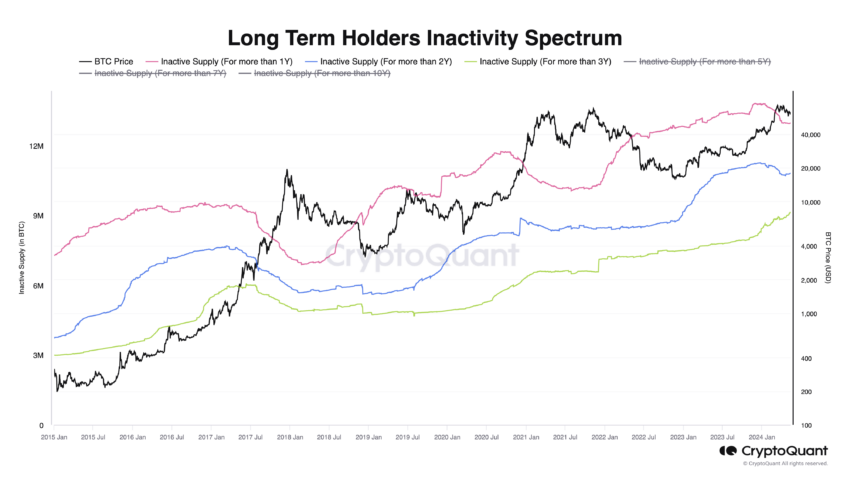 LTH Inactivity Spectrum. Source: CryptoQuant
With the price recovering from the $56,000 correction, we can observe that these cohorts have halted the distribution of Bitcoins. Both the 1-year+ and 2-year+ cohorts have ceased selling, indicating a shift towards holding rather than distributing their BTC.
Understanding Bitcoin’s On-chain Support and Resistance Levels with the URPDThe URPD (Unspent Realized Price Distribution) metric provides valuable insights into where Bitcoin is held at various price levels. Think of it as a map that shows the prices at which most people have bought their BTC.
A significant portion of Bitcoin is held at prices within the current trading range of $67,500 to $70,000 USD. Specifically, 6% of Bitcoin’s total supply is held in this price range. This concentration of holdings indicates that many buyers purchased BTC at these prices.
These holders will likely maintain their positions rather than sell quickly, creating a robust support level that helps prevent sharp price declines.
Only 1.1% of Bitcoin’s total supply exceeds the $70,000 price level. This small percentage suggests that very few people bought BTC at prices higher than today’s price. Consequently, there aren’t many sellers looking to sell their Bitcoin for a quick profit, as they would either be at a loss or break-even point.
This lack of selling pressure above the current price creates a favorable environment for potential upward movement, as there is less resistance from profit-taking.
Read more: Bitcoin Price Prediction 2024/2025/2030
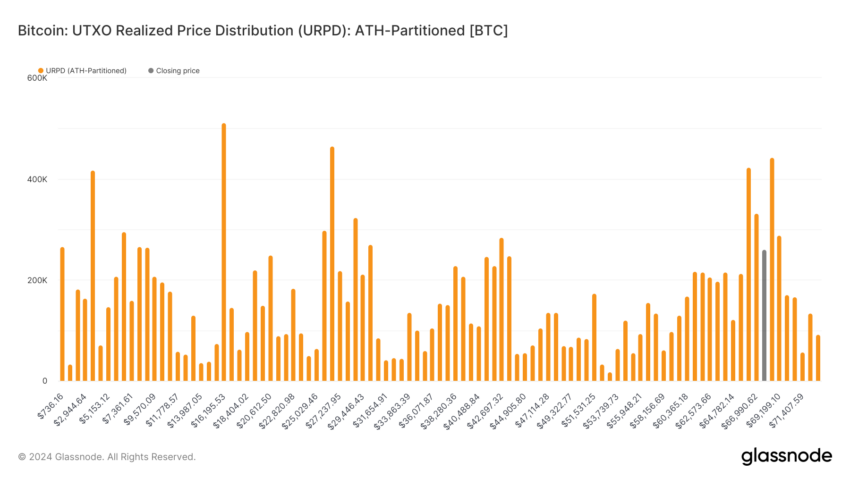 Bitcoin URPD. Source: Glassnode
Strategic Recommendations
Bitcoin URPD. Source: Glassnode
Strategic Recommendations
This setup is good news for Bitcoin because it suggests two things:
Strong Support: The large amount of Bitcoin held just below the current price acts like a safety net. If the price drops a bit, many buyers will likely step in and buy more, preventing the price from falling too much.
Room for Growth: With very little Bitcoin held above the current price, there aren’t many holders looking to sell quickly. This means that if more entities start buying Bitcoin, the price can rise quickly to $73,000 because there isn’t much resistance from sellers.
Despite the bullish signals, investors should also be prepared for a potential price reversal. If Bitcoin breaks below the daily Ichimoku cloud, sentiment could shift to neutral, and the price might trend towards $64,000.
It’s essential to have a risk management strategy in place to handle such scenarios, including setting stop-loss orders and being ready to adjust positions accordingly.
The post Bitcoin (BTC) On-Chain Dynamics Hint at Bullish Move: Key Factors appeared first on BeInCrypto.