Bitcoin’s ‘Unlucky 13 Problem’ Explained: Here’s Why Every Price Bounce Keeps Failing
Bitcoin trades near $87,820, flat on the day and still down about 4% over the last 30 days. Buyers appear at every Bitcoin price dip, but each bounce has failed to move outside the same narrow range. The chart now shows a clear reason why attempts keep stalling.
The short answer: Bitcoin’s unlucky 13 problem. A key on-chain resistance level sits 13% above the current price, and until it breaks, upside keeps fading before momentum can form.
Short-Term Holders Set the Ceiling With A Cost Basis HurdleGlassnode’s Short-Term Holder Cost Basis model tracks the average price where recent buyers hold coins. Short-term holders usually react fastest to volatility. When prices trade below their entry, they sell to avoid deeper losses. This creates an automatic layer of sell pressure that acts like a ceiling on the chart.
Right now, that cost basis sits at $99,790, roughly 13% above spot. At $87,820 (current price), most recent buyers are underwater. This explains why every Bitcoin rally fades before it can build toward a breakout: sellers keep stepping in early.
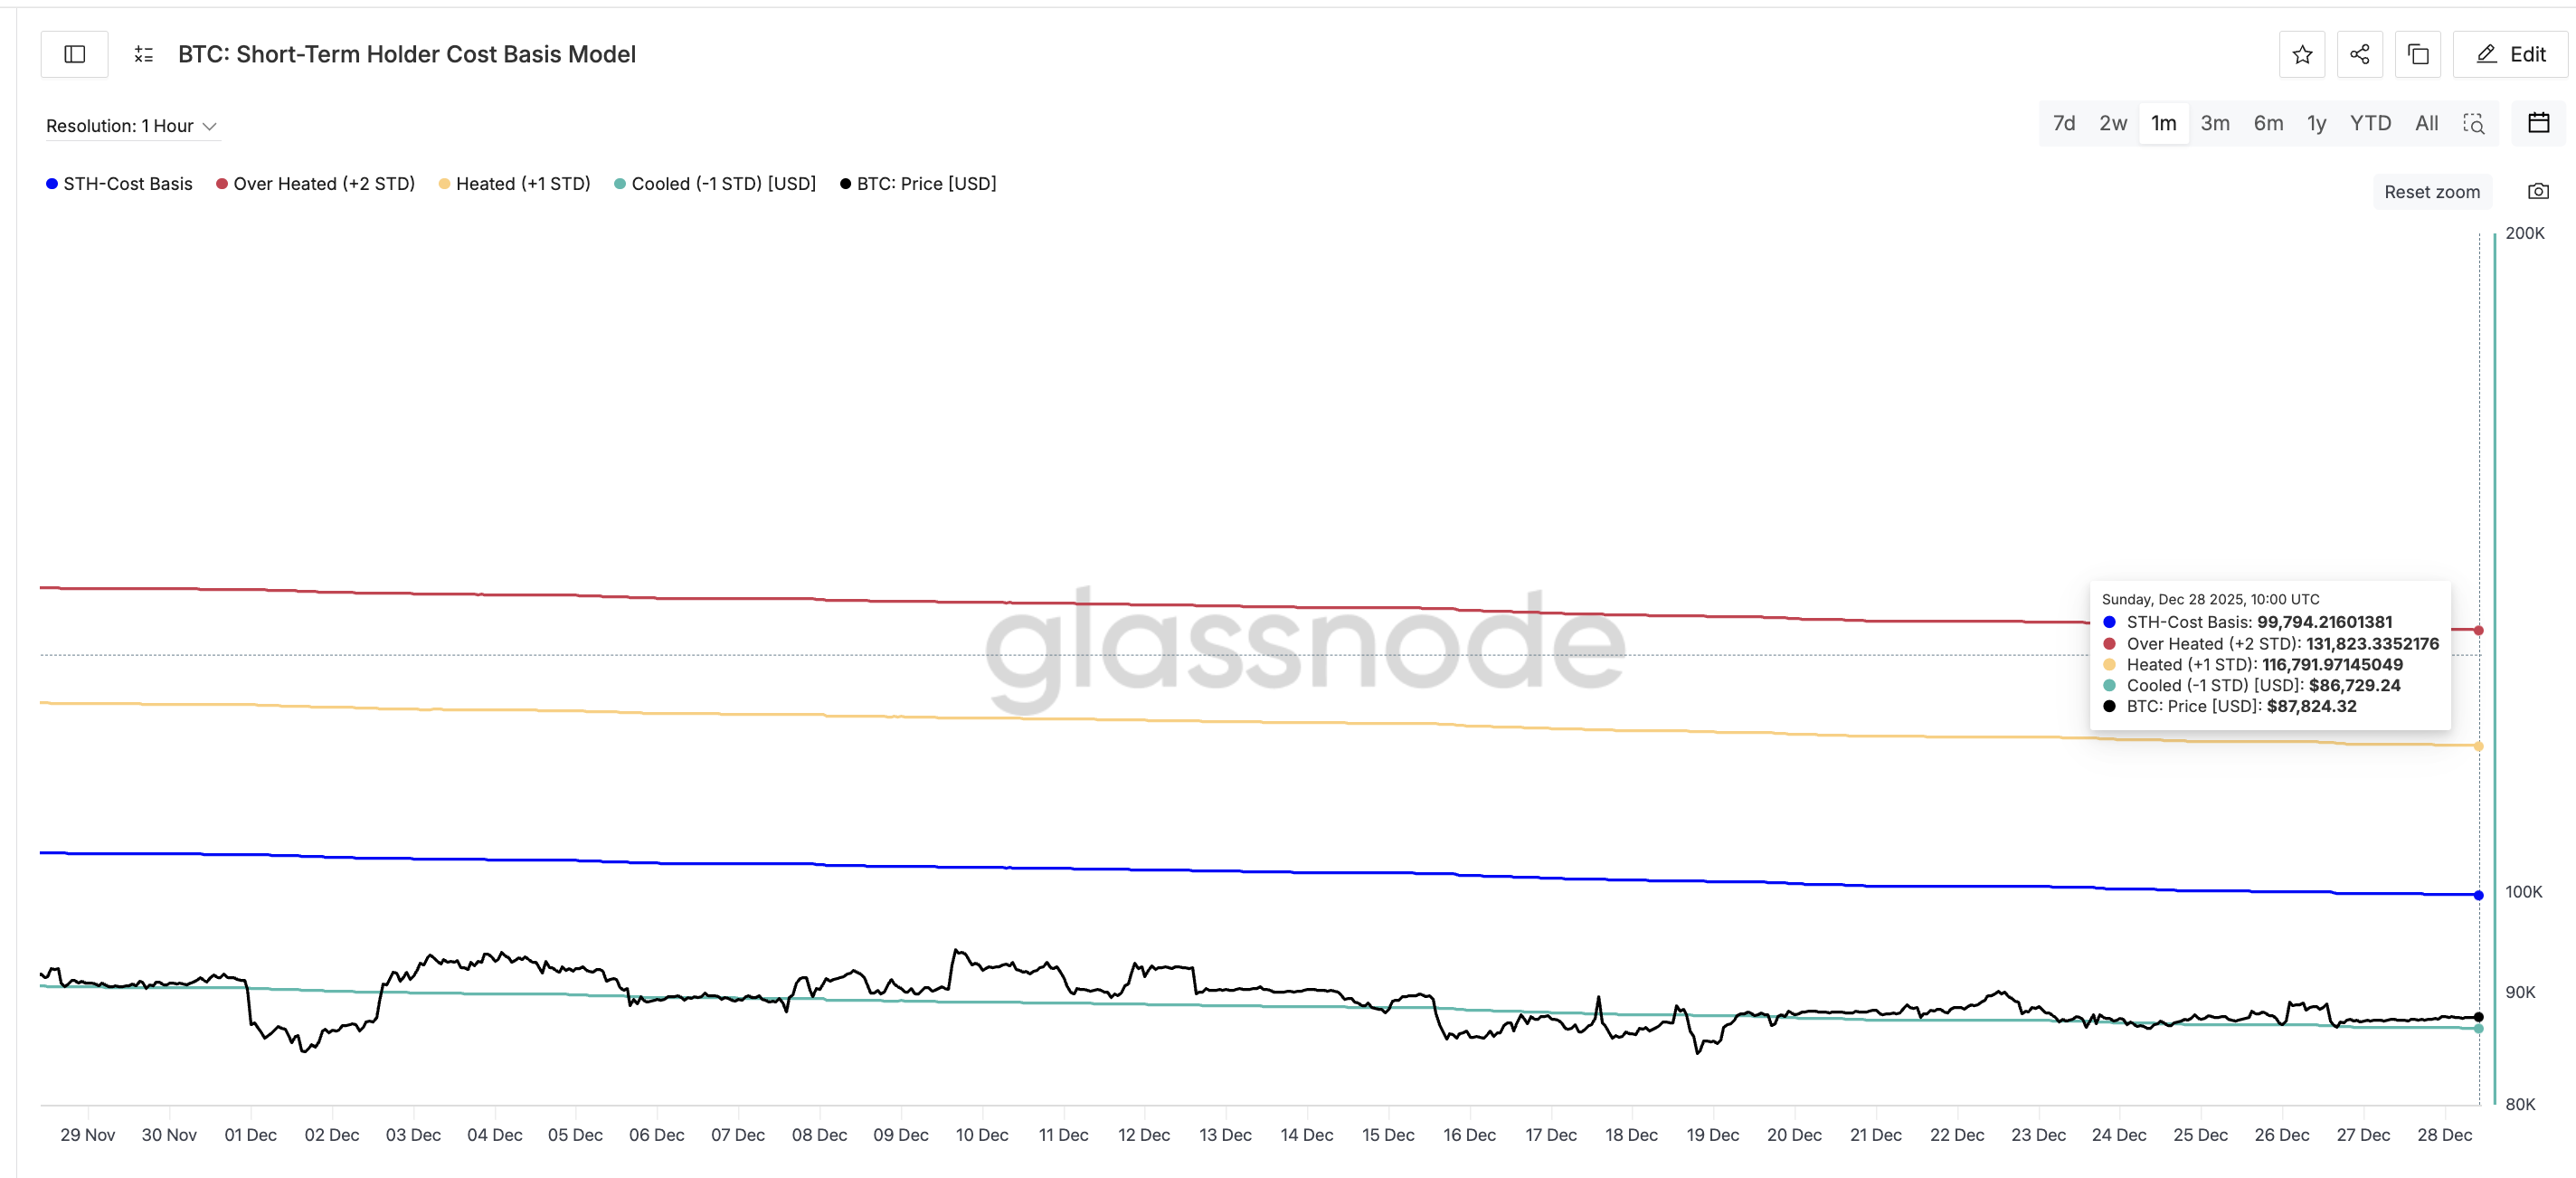 Cost Basis Model: Glassnode
Want more token insights like this? Sign up for Editor Harsh Notariya’s Daily Crypto Newsletter here.
HODL Waves data, a metric that segregates cohorts by holding age, confirms this behavior. The 1-day to 1-week cohort (short-term cohort) dropped from 6.38% of supply on November 27 to 2.13% on December 27. These newer buyers are offloading coins rather than holding them, which reinforces resistance before Bitcoin even reaches $99,790.
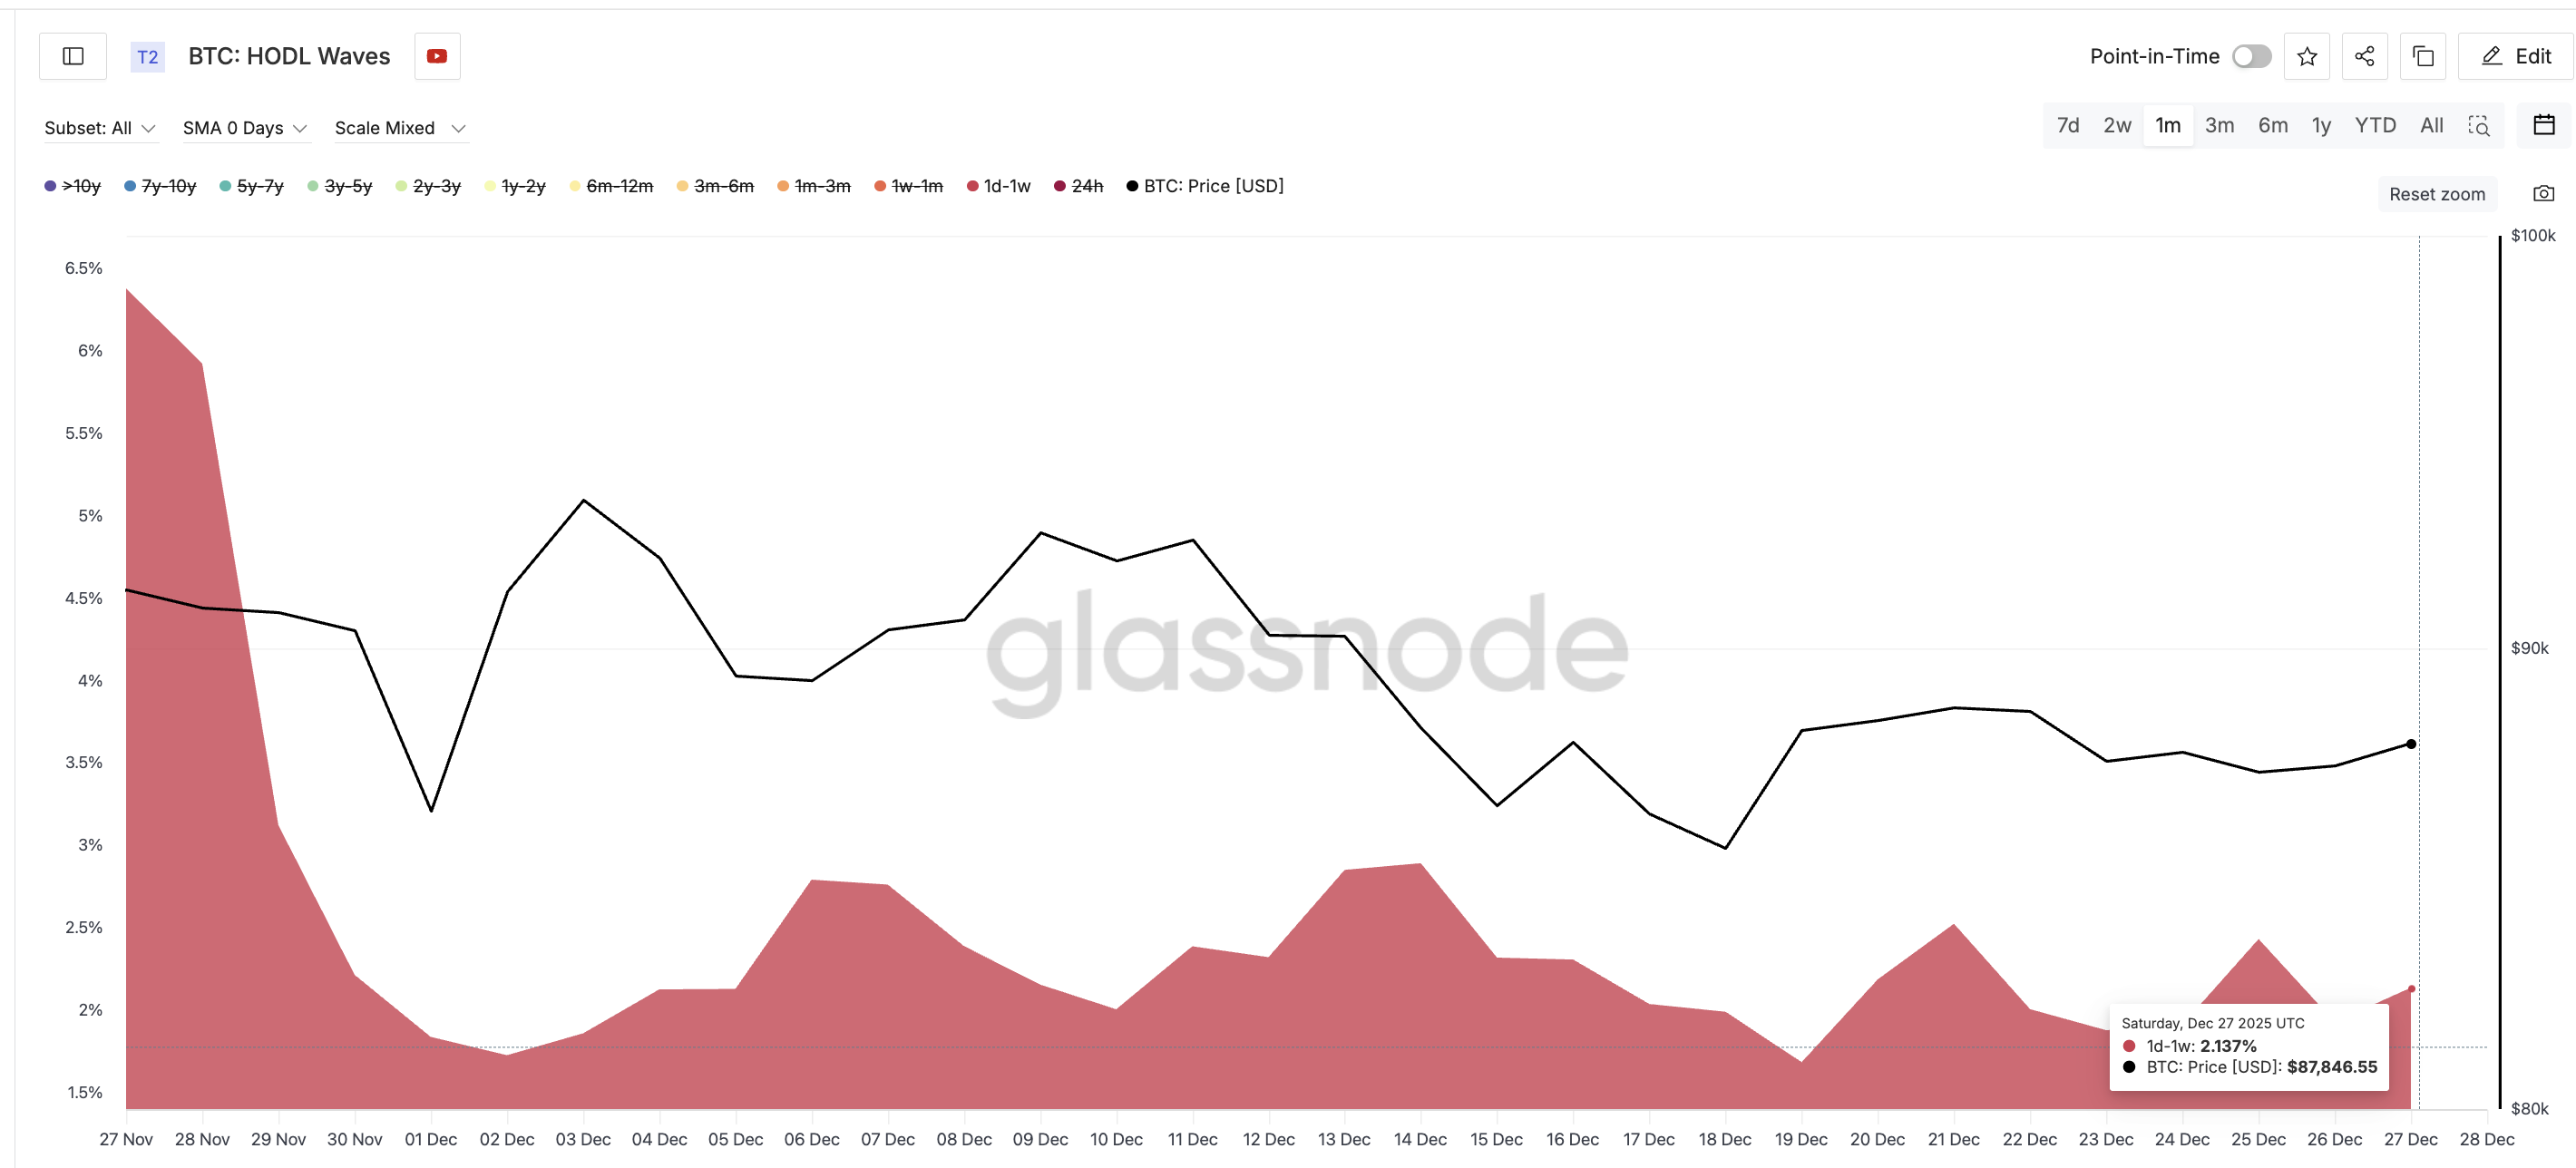 Short-Term Holders Cutting Supply: Glassnode
This makes $99,790 the most important resistance on Bitcoin’s chart, in the near term. It is worth noting that this on-chain resistance level is dynamic and could shift depending on the spot price. Therefore, we would also want a level verification on the technical chart.