Binance Coin (BNB) Eyes Monthly Low, Short-Term Rally in Doubt
Binance Coin (BNB) has dropped over 10% in value during the past seven days. Since August 23, the altcoin has been trading below a descending trend line, confirming its ongoing decline.
The technical setup at the time suggests that BNB could face further losses in the short term. With diminishing bullish momentum, there’s a possibility that BNB may revisit its 30-day low.
Binance Coin Faces Surge in Selling PressureAt press time, Binance Coin (BNB) is trading at $505.65. After reaching a monthly peak of $600 on August 23, the altcoin’s price has sharply declined. With increasing bearish sentiment, BNB seems likely to continue its downward trend.
The Moving Average Convergence/Divergence (MACD) indicator supports this outlook. Currently, BNB’s MACD line (blue) is below both its signal line (orange) and the zero line. The MACD is a key indicator that helps identify trend directions, changes, and potential price reversal points, suggesting that BNB may face further declines in the near term.
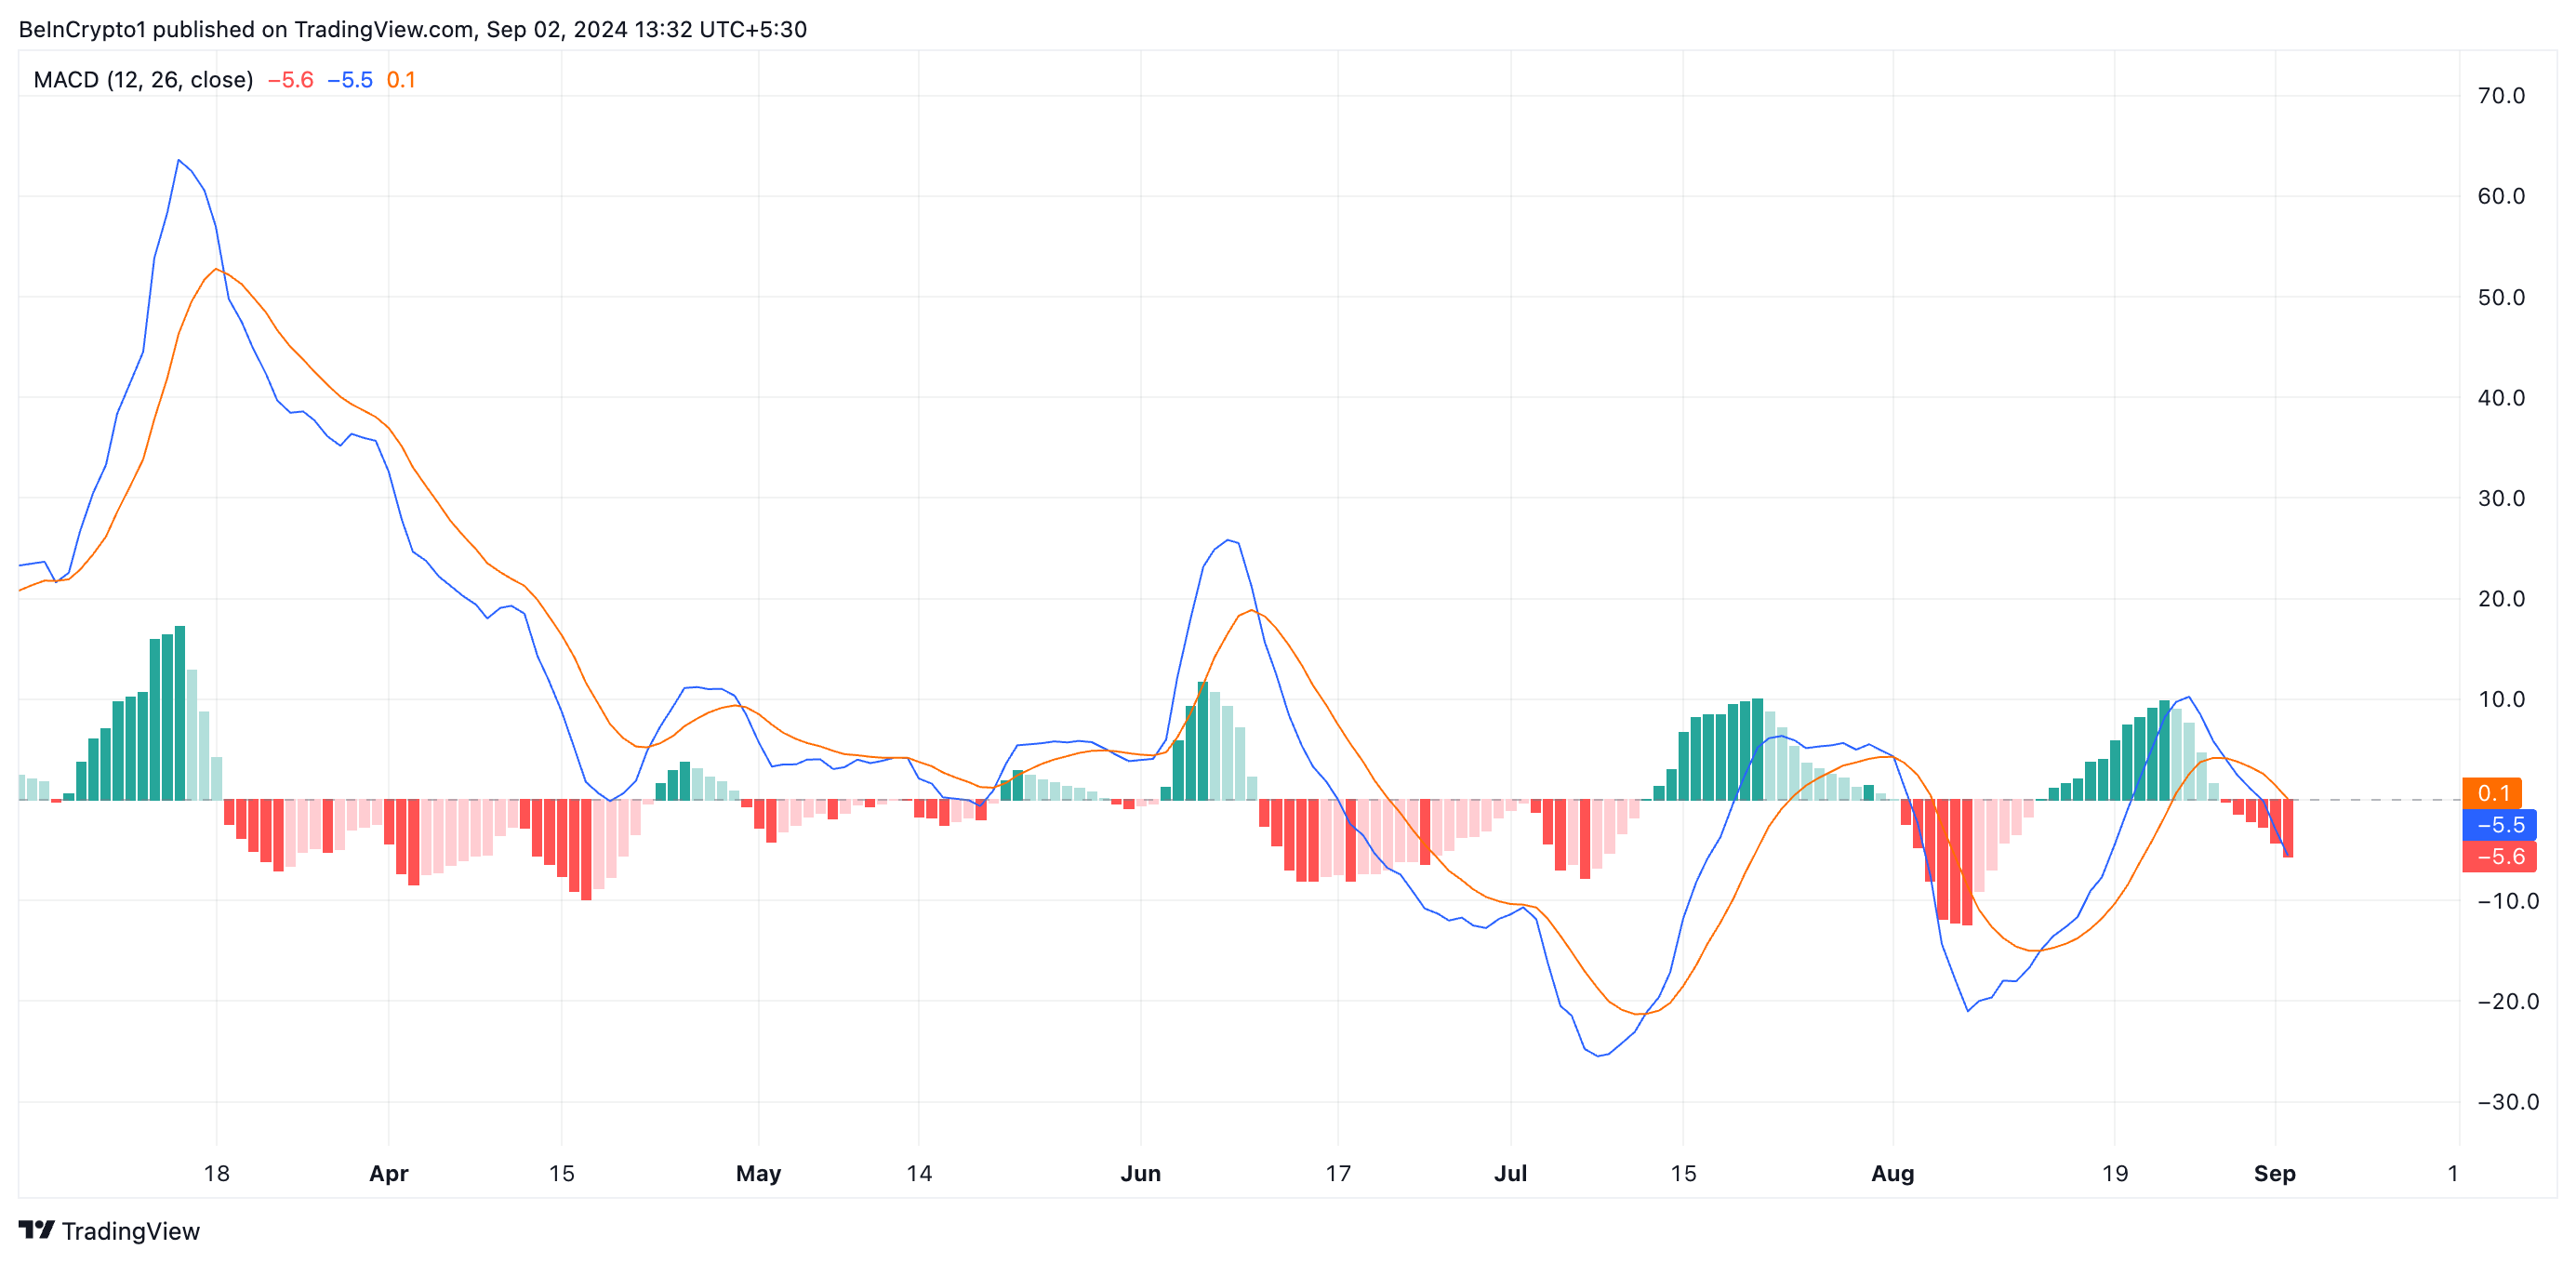 Binance Coin Moving Average Convergence/Divergence. Source: TradingView
When the MACD line is below both the signal and zero lines, it indicates strong bearish sentiment in the market. The fall below the signal line suggests that the momentum behind the price is weakening, while crossing below the zero line confirms that the downtrend is gaining strength. Unless there is a shift towards positive market sentiment, the price is likely to continue declining. Traders often interpret this bearish signal as a cue to exit long positions and consider taking short positions.
Additionally, BNB’s Directional Movement Index (DMI) further reinforces the bearish outlook. The negative directional indicator (-DI) (red) is currently above the positive directional indicator (+DI) (blue), showing that bears have strong control over the market.
Read more: How To Trade Crypto on Binance Futures: Everything You Need To Know
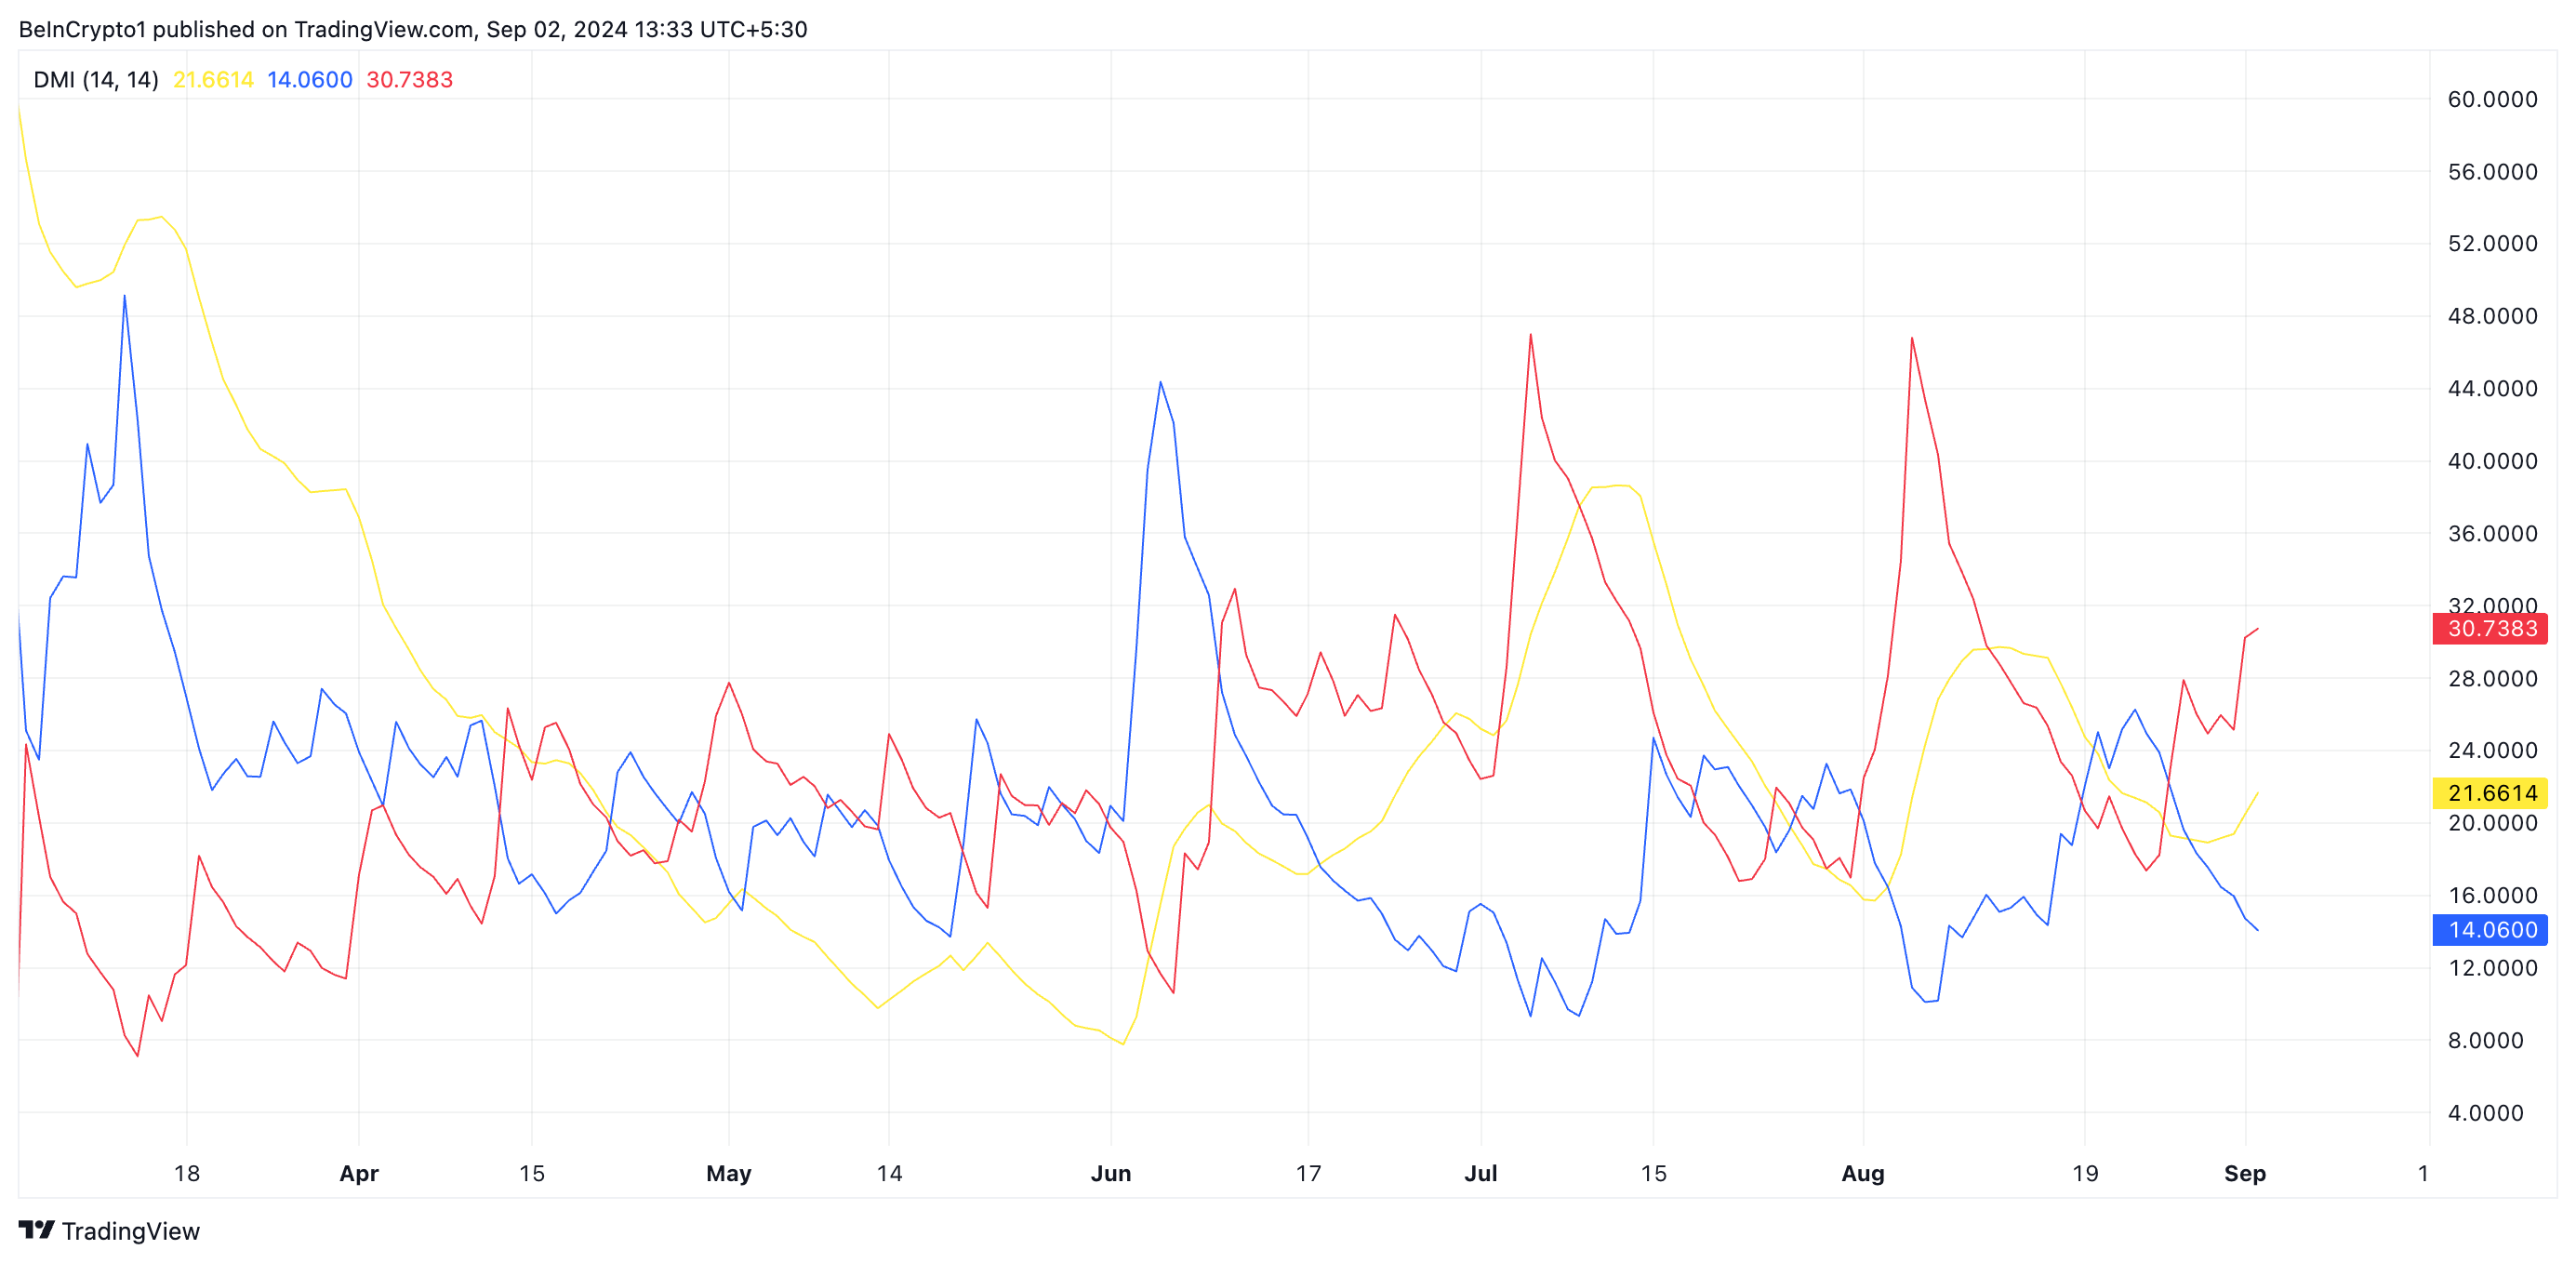 Binance Coin Directional Movement Index. Source: TradingView
When the +DI is below the -DI, it suggests that the downtrend is strong. This indicates bearish market conditions, where selling pressure outweighs buying activity, making it likely that the asset will continue its downward trend.
BNB Price Prediction: Futures Traders Take Their LeaveIn BNB’s derivatives market, futures open interest has decreased since the price began trading below the descending trend line. According to data from Coinglass, the coin’s futures open interest has dropped by 18% during this period.
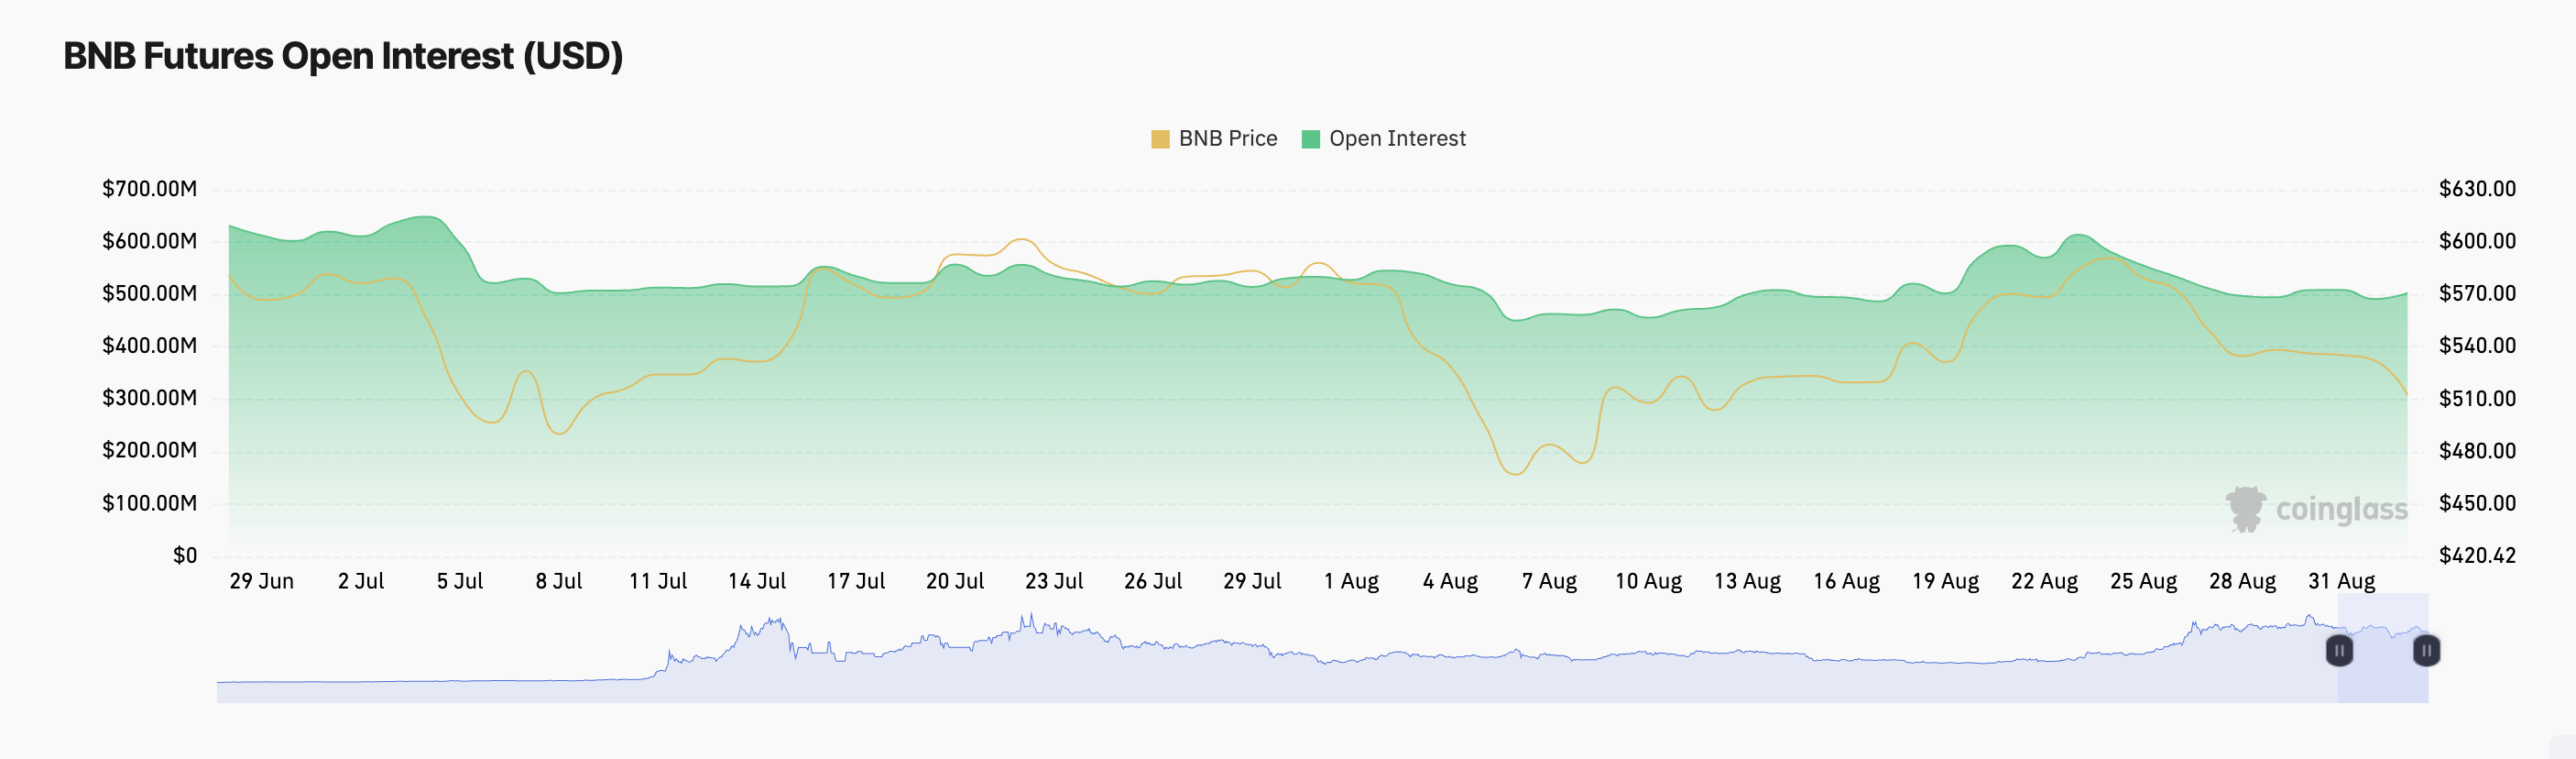 Binance Coin Futures Open Interest. Source: Coinglass
Futures open interest represents the total number of outstanding futures contracts that have not yet been settled. A decline in open interest typically indicates that traders are closing their positions and exiting the market. If BNB’s buying pressure continues to weaken, the price could fall below $500, potentially reaching $475.90.
Read more: Binance Coin (BNB) Price Prediction 2024/2025/2030
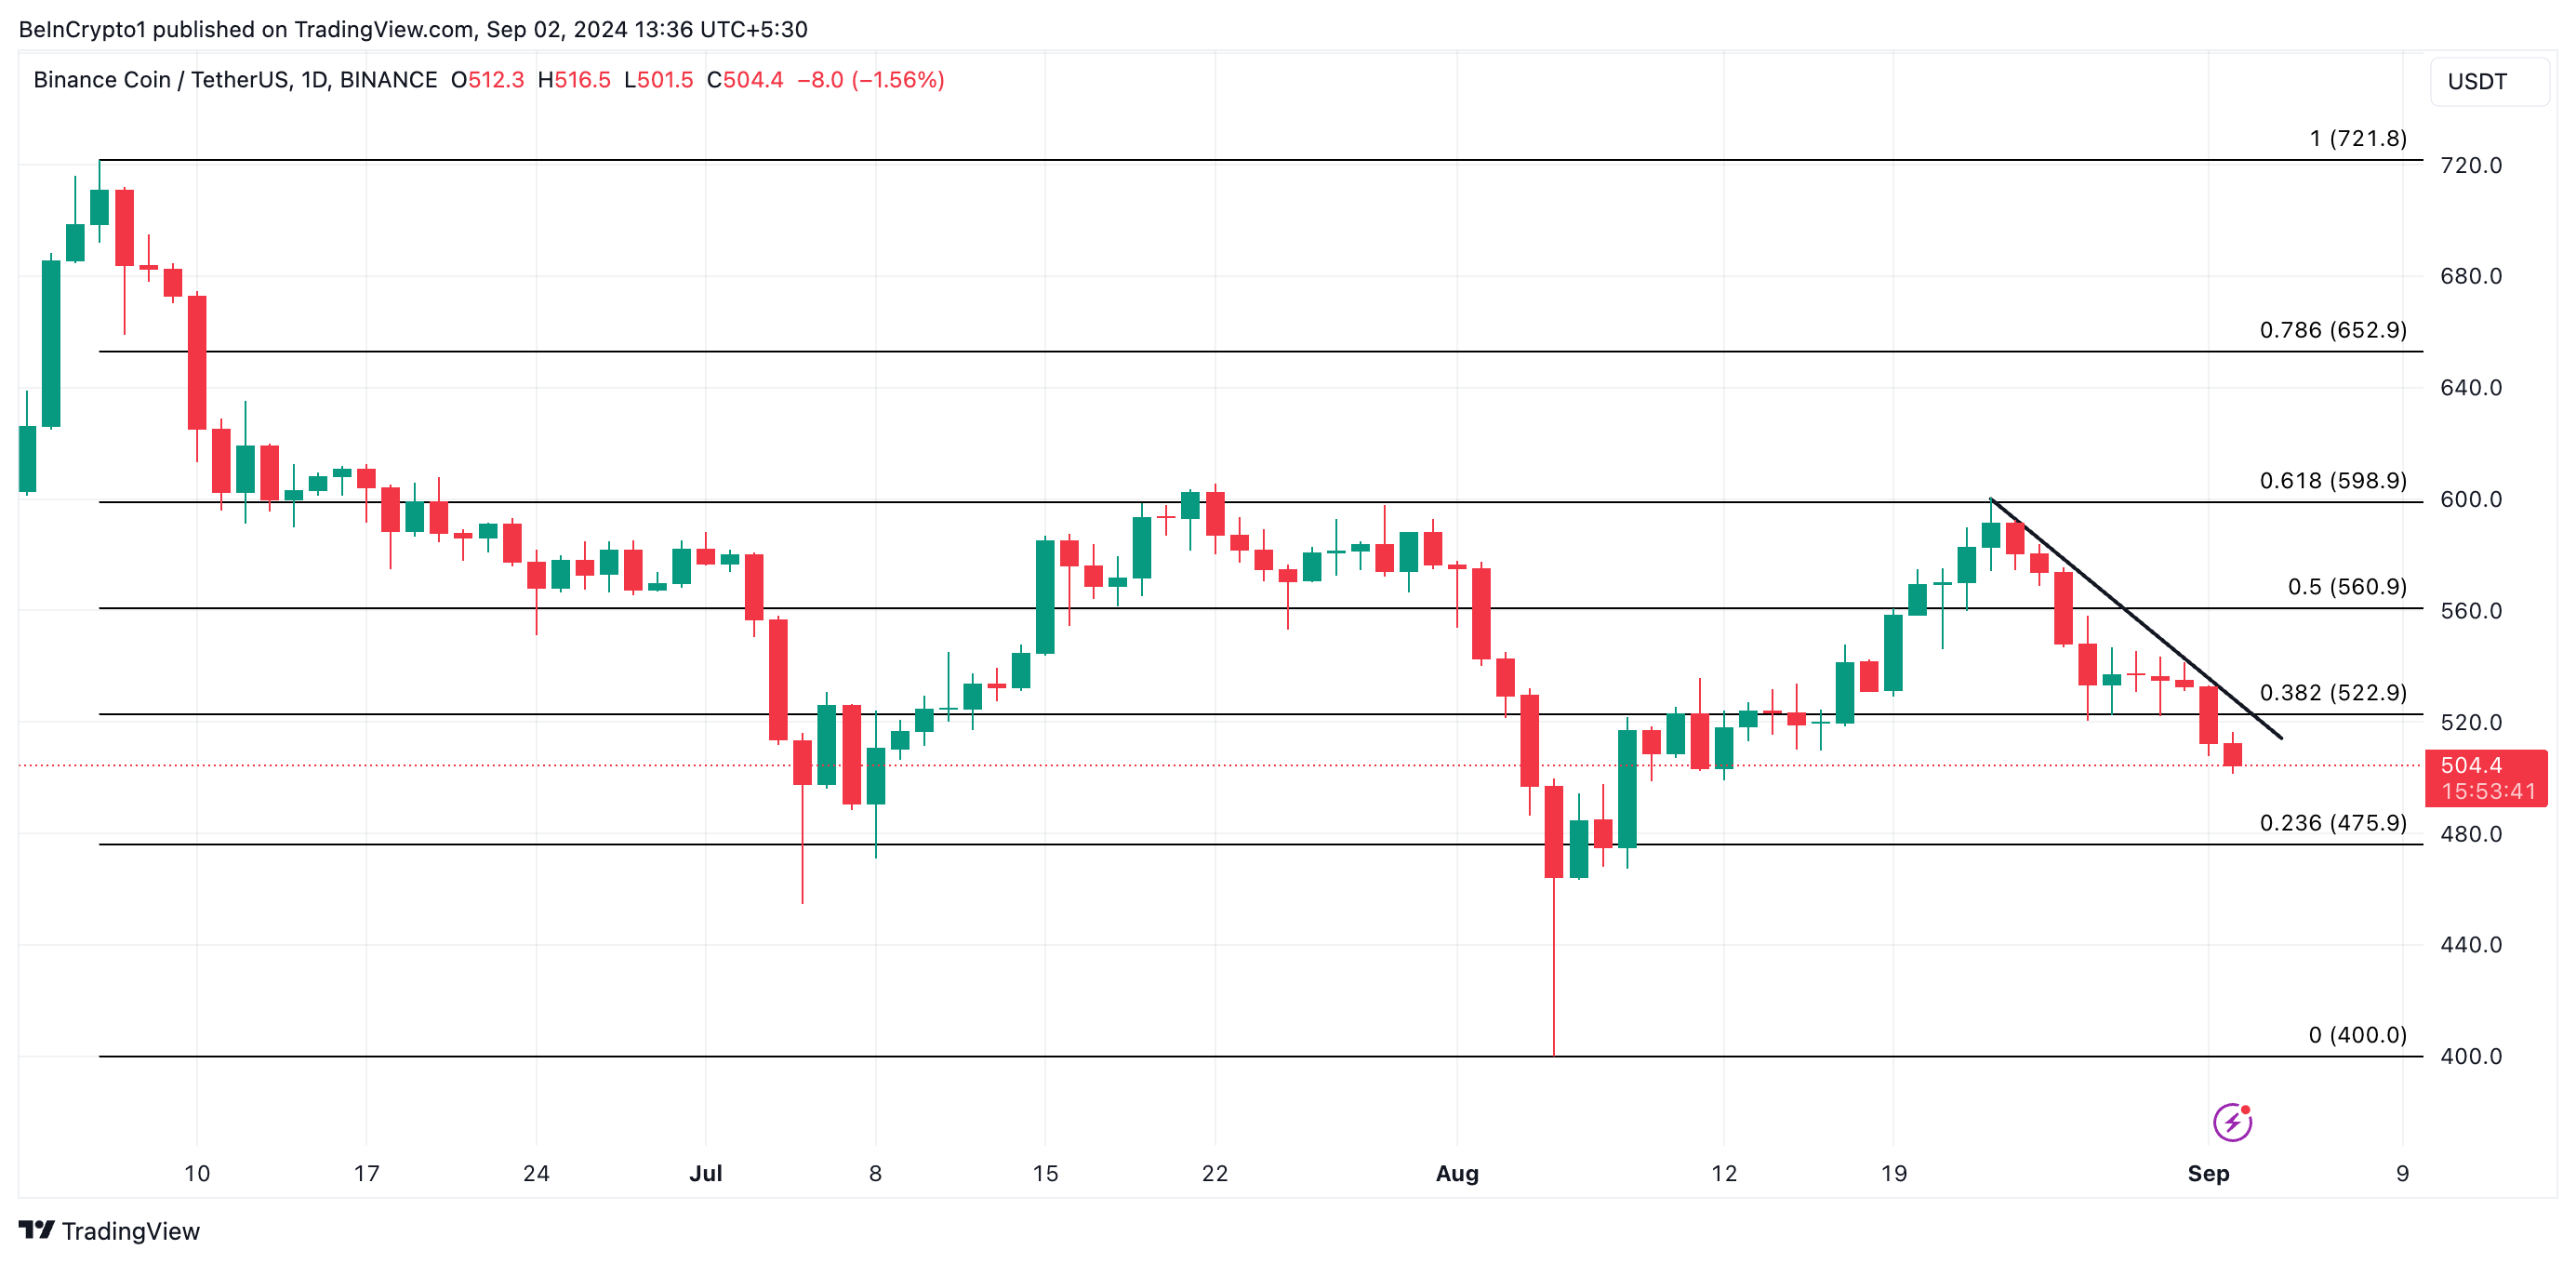 BNB Price Analysis. Source: TradingView
However, if market sentiment shifts from negative to positive, BNB’s price could rally to $522.90. This potential increase would reflect renewed buying interest and a reversal of the current bearish trend.
The post Binance Coin (BNB) Eyes Monthly Low, Short-Term Rally in Doubt appeared first on BeInCrypto.