4 Cryptos That Could Drop to New Lows in June 2024
It is no longer news that the cryptocurrency market witnessed a surge in trading activity in May. This drove the values of many altcoins to new highs. In the past 30 days, global cryptocurrency market capitalization has spiked by 17%.
However, as we enter June, some altcoins are poised for decline. Crypto assets such as Cardano (ADA), Bitcoin Cash (BCH), Axie Infinity (AXS), and The Sandbox (SAND) have seen a growth in bearish sentiments, which put them at risk of shedding some of their gains in the short term.
Cardano (ADA) Bears Have LeverageAs of this writing, Cardano traded at $0.44. Its price peaked at $0.50 on May 21 and has declined 12%.
Its Awesome Oscillator (AO) confirmed the current trend of ADA distribution as the indicator returned red histogram bars at press time. This indicator measures market momentum and identifies an asset’s current trend and potential price reversal points.
When an asset’s AO shows red bars, its short-term momentum falls faster than its long-term momentum. Red bars typically suggest an increase in selling pressure and hint at the possibility of a price decrease.
For context, ADA’s AO has returned only red bars since April 1, suggesting that bearish bias has dominated the coin’s market for over 60 days.
Read More: How To Buy Cardano (ADA) and Everything You Need To Know
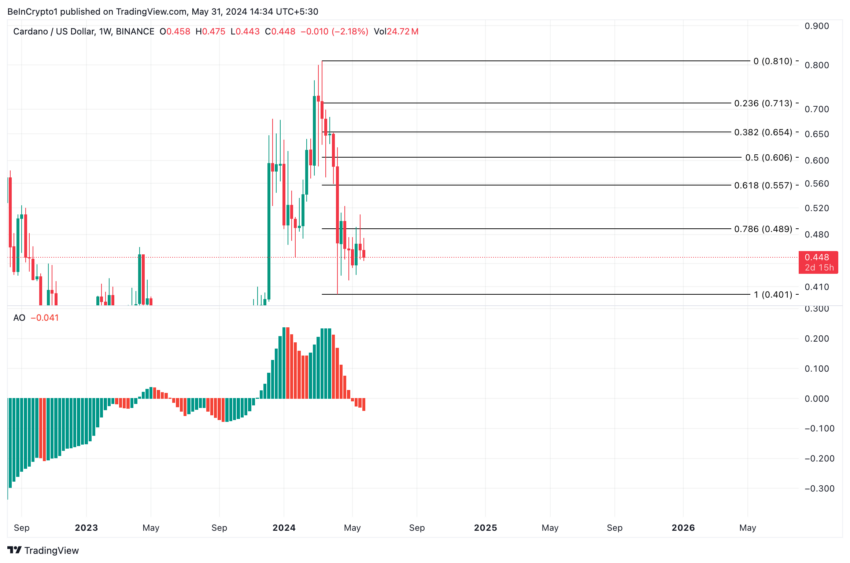 Cardano Analysis. Source: TradingView
If selling pressure continues to mount, ADA’s price might fall to $0.40, a price level it last traded at in December 2023.
Bitcoin Cash (BCH) Bulls Take the BackseatThe price per Bitcoin Cash (BCH) has cratered by over 10% in the past ten days. This is attributable to a surge in capital flight from the coin’s market, which was confirmed by readings from its Chaikin Money Flow (CMF).
This indicator measures money flow into and out of the BCH market. Traders use it to gain insights into the strength and direction of a trend. It signals market strength when its value is positive and above the zero line. It suggests that buying pressure is high and money flows into the market.
Conversely, a negative CMF value shows that more people are selling than buying, a precursor to a price decline.
The altcoin’s CMF has been positioned below the zero line since May 23. As of this writing, the indicator’s value was -0.06.
Further, the dots that makeup BCH’s Parabolic Stop and Reverse (SAR) indicator confirmed the hike in selling pressure, especially in the past few days. This indicator also tracks an asset’s price trend.
Read More: How To Buy Bitcoin Cash (BCH) and Everything You Need To Know
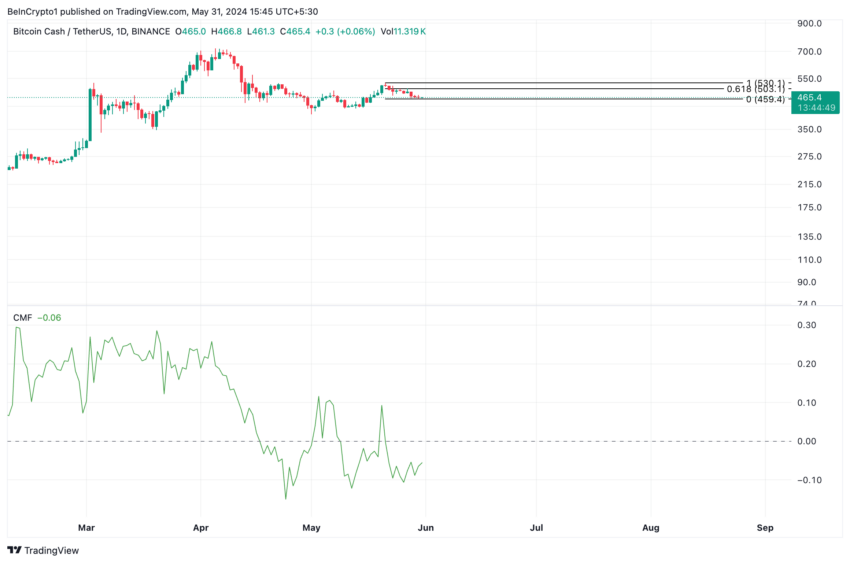 Bitcoin Cash Analysis. Source: TradingView
When its dots rest above the asset’s price, the market is said to be in decline due to a surge in selling activity. If this trend of BCH distribution continues, its next price point might be $459.4.
Axie Infinity (AXS) Leans Towards Taking More LossesThe price of AXS, the governance token that powers the leading play-to-earn gaming platform Axie Infinity, rose by 11% last month. However, with its price falling under its 20-day Exponential Moving Average (EMA), signaling a spike in selling pressure, AXS may shed some of these gains in the coming weeks.
The 20-day EMA is significant because it helps to track an asset’s average price over the past 20 days. When an asset’s price falls below this key moving average, it signals a shift from buying to selling. It is a bearish signal, and traders interpret it as a sign of a trend reversal from an uptrend to a downtrend.
Read More: Axie Infinity (AXS) Explained for Beginners
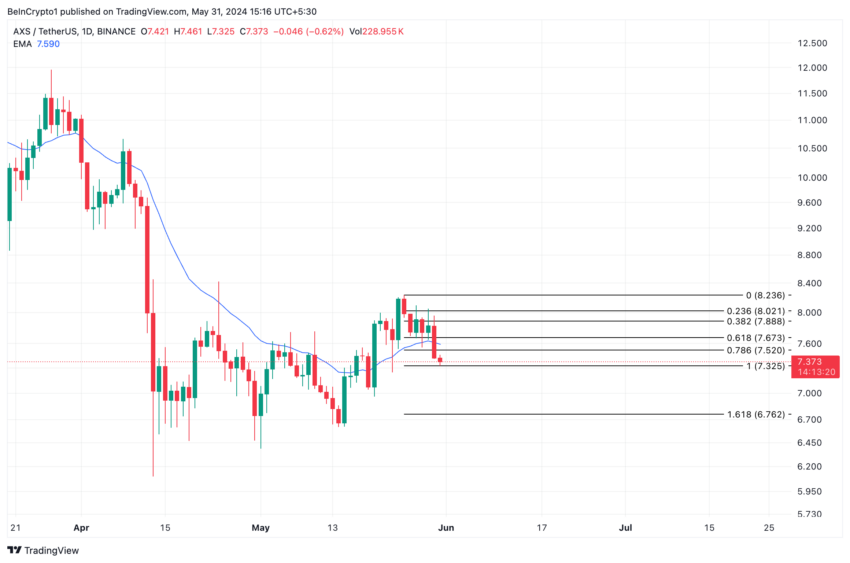 Axie Infinity Analysis. Source: TradingView
If AXS’ selling pressure continues to skyrocket, its price may fall to $7.3 and then to the long-term support level of $6.76 if profit-taking continues unabated.
The Sandbox (SAND) Sees Rising Sell-OffsThe last of the altcoins is Sandbox (SAND); the current set of SAND’s Moving Average Convergence/Divergence (MACD) indicator shows that its short-term average is falling below its long-term average. This is a bearish signal that market participants interpret as a cue to take short and exit long positions.
This indicator is used to identify changes in an asset’s trend, momentum, and strength. As observed in SAND’s current setup, when the MACD line (blue) crosses below the signal line (orange), traders are told it may be a good time to sell as the downward pressure on the asset’s price increases.
Read more: Top 10 Metaverse Platforms To Watch Out for in 2023
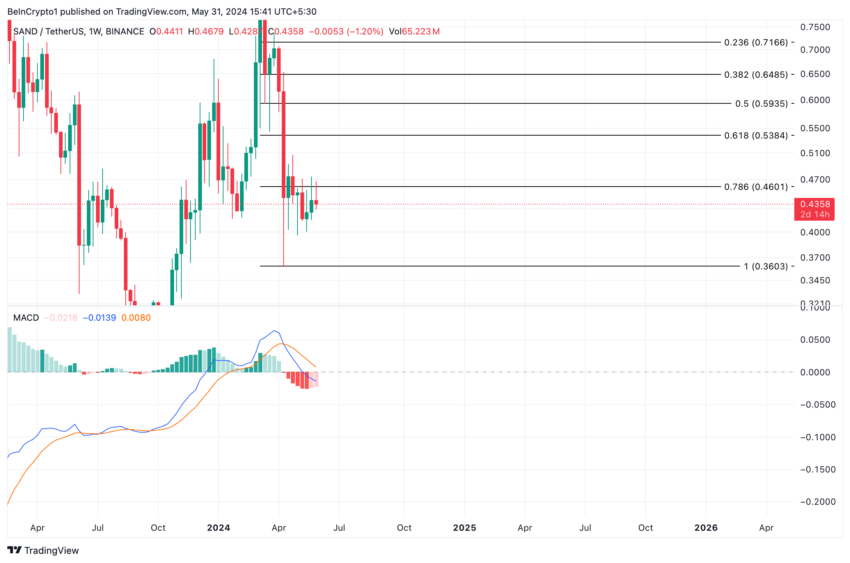 The Sandbox Analysis. Source: TradingView
If SAND sell-offs gain momentum, SAND may fall under $0.4 to exchange hands at $0.36
The post 4 Cryptos That Could Drop to New Lows in June 2024 appeared first on BeInCrypto.