3 Reasons Chainlink (LINK) Price Could Fall to Single Digits
Since the second quarter of the year, many altcoins, including Chainlink (LINK), have struggled to achieve significant gains. This marks a stark contrast to their performance between January and March.
As a result of this, the market has aggressively shifted toward uncertainity and fear. But will LINK survive this time?
Low Network Activity Threatens Chainlink’s RevivalOne metric that underscores Chainlink’s ongoing weak performance is the price-Daily Active Addresses (DAA) divergence. This metric helps determine whether network activity is supporting the price movement.
When active addresses, which measure user participation on a blockchain, increase alongside the price, the cryptocurrency in question might hit a higher value. If the network activity rises while the price is down, it implies that respite could be nearby as it presents a buy signal.
However, a decrease in the DAA is usually a bearish signal. As seen below, LINK’s price DAA divergence stands at -56.35%. This negative divergence suggests a weak disconnect between the altcoin’s price and user engagement.
Read more: What Is Chainlink (LINK)?
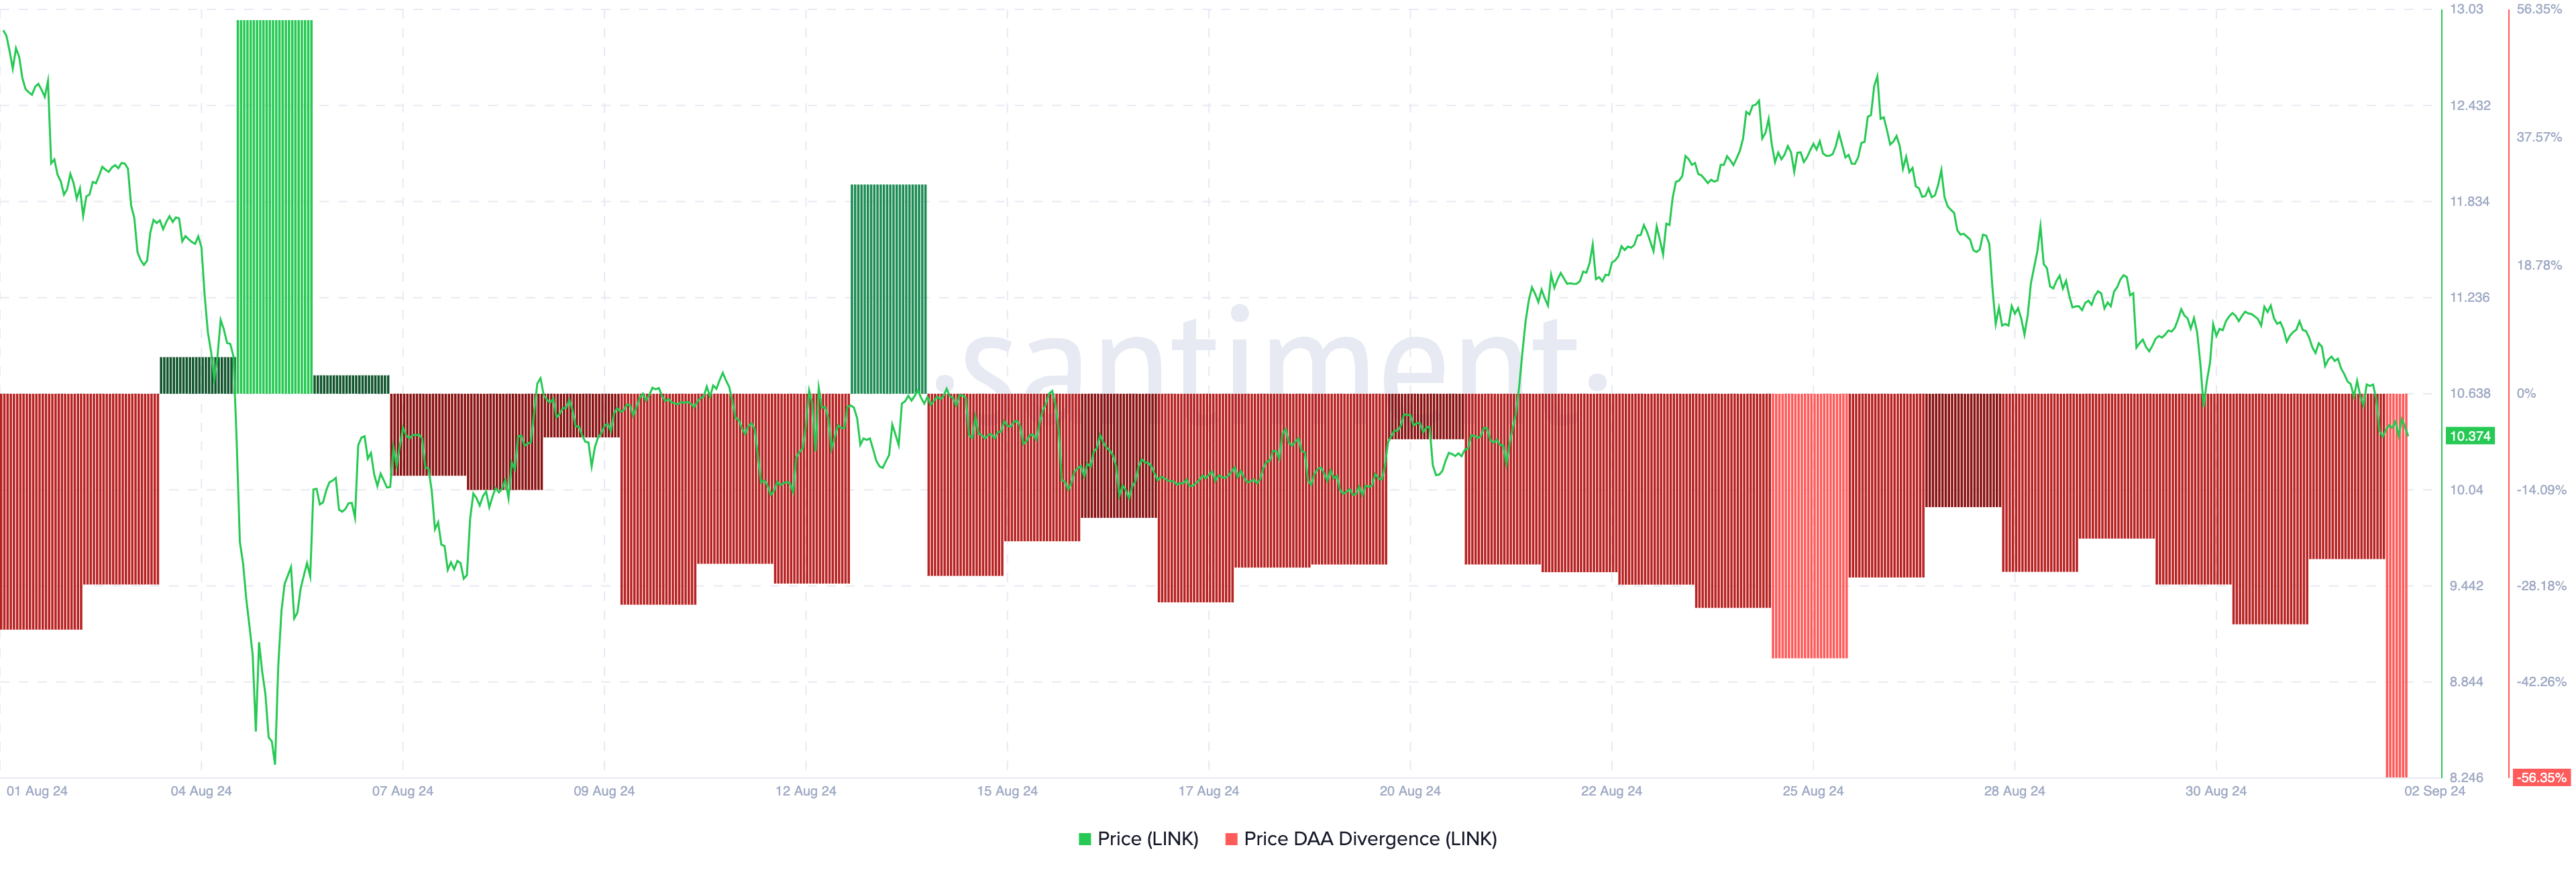 Chainlink Price DAA Divergence. Source: Santiment
The In/Out of Money Around Price (IOMAP) indicator also supports this outlook. The IOMAP categorizes addresses based on whether they are in profit, at a loss, or at the breakeven point.
If an address purchased a token at a price lower than the current value, it’s considered “in the money.” Addresses that bought at a higher price are “out of the money,” while those that bought at the current price are at breakeven.
The higher the number of addresses within a specific price range, the stronger the support or resistance at that level. According to IntoTheBlock, around 5,540 addresses bought 4.46 million LINK at roughly $10.16, putting them in the money. In contrast, over 8,000 addresses purchased 17.94 million LINK at about $10.52, placing them out of the money.
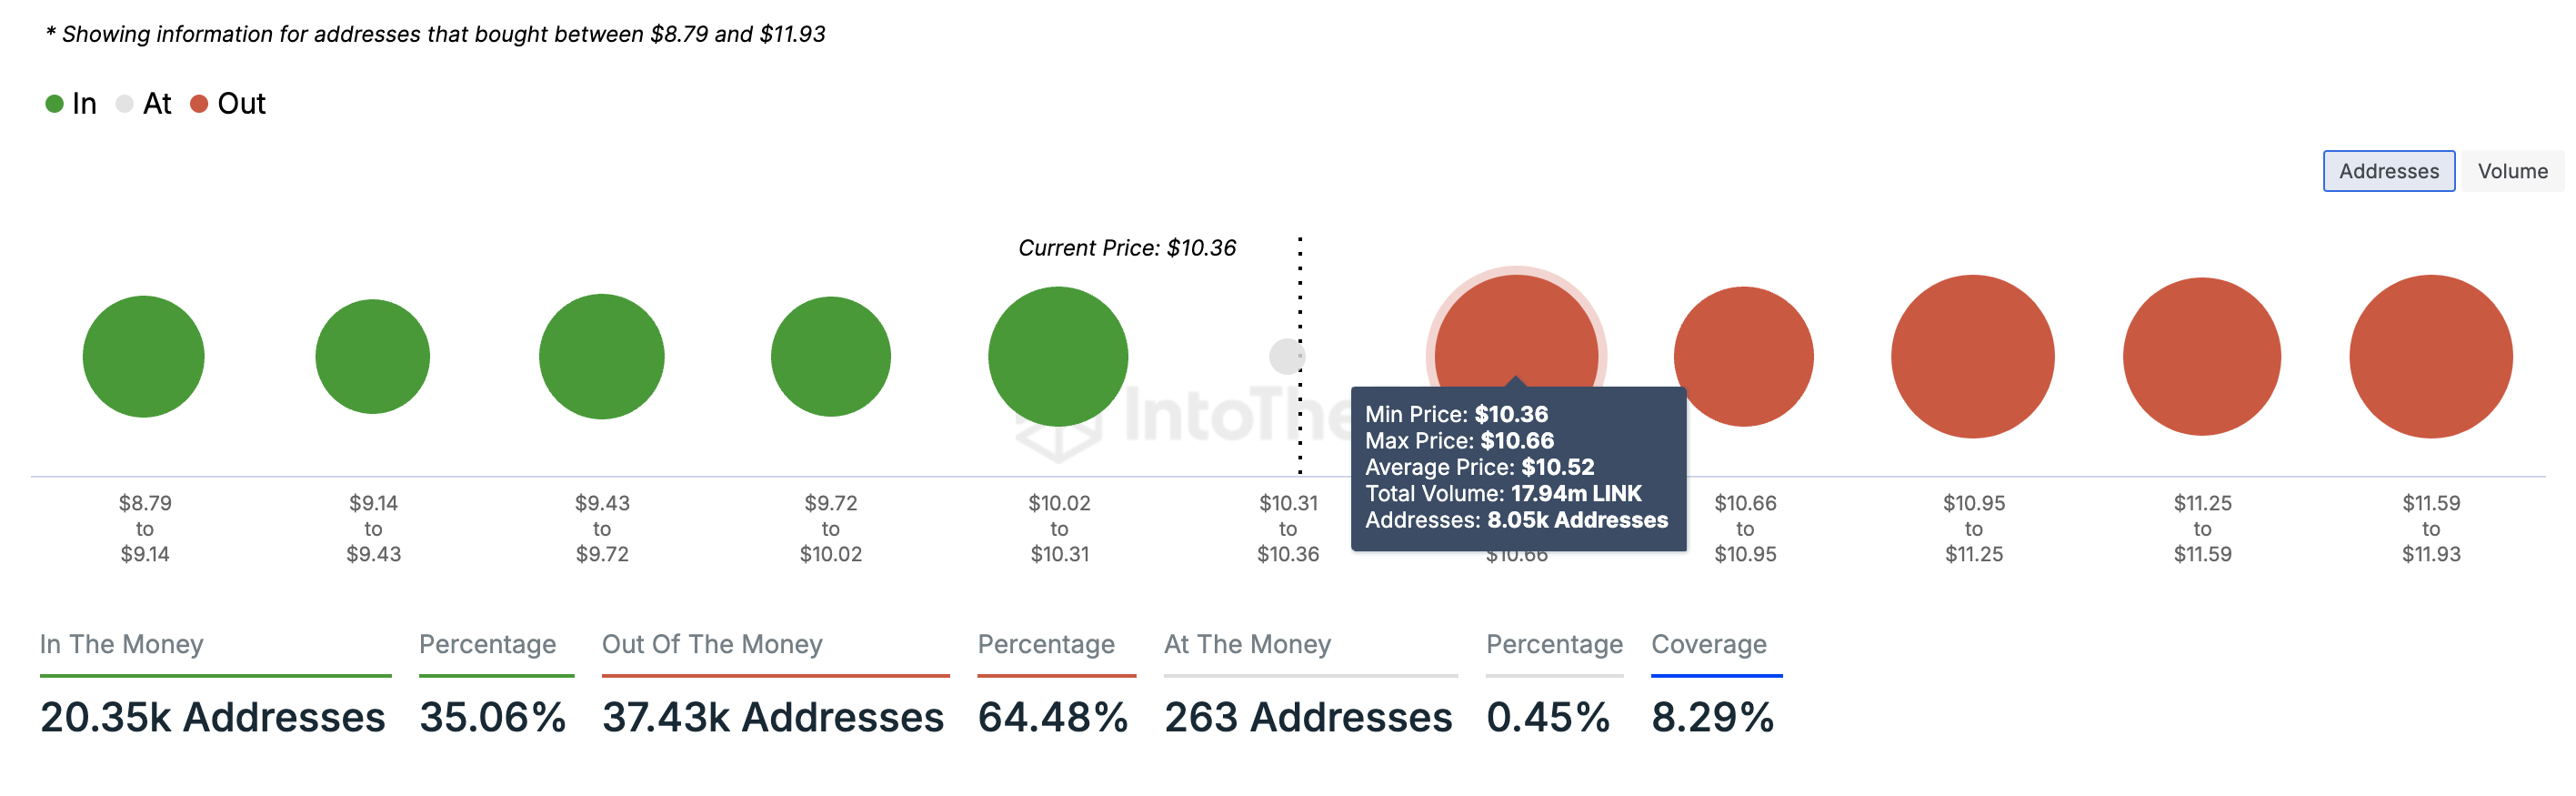 Chainlink In/Out of Money Around Price. Source: IntoTheBlock
Based on the conditions stated earlier, the LINK price might not have enough support to prevent another downtrend. Instead, it could face resistance, potentially dropping to $9.72 in the coming days.
LINK Price Prediction: The Token Looks Set for $9.72Two weeks ago, LINK broke out of a bearish pennant, a technical pattern that signals the continuation of a downtrend. Invalidating the bearish bias at that time drove LINK’s price to $12.62.
However, later on, the altcoin’s value dropped by 19.38%, suggesting that the earlier surge was a fakeout. From the daily chart shown below, Chainlink bulls might be working toward sending the price higher.
Additionally, the resistance at $10.73 suggests that the cryptocurrency might fail to sustain the uptrend. If this happens, a notable pullback could be next. Going by the Fibonacci retracement indicator shown on the chart, LINK’s next target rests around $9.72.
Read more: Chainlink (LINK) Price Prediction 2024/2025/2030
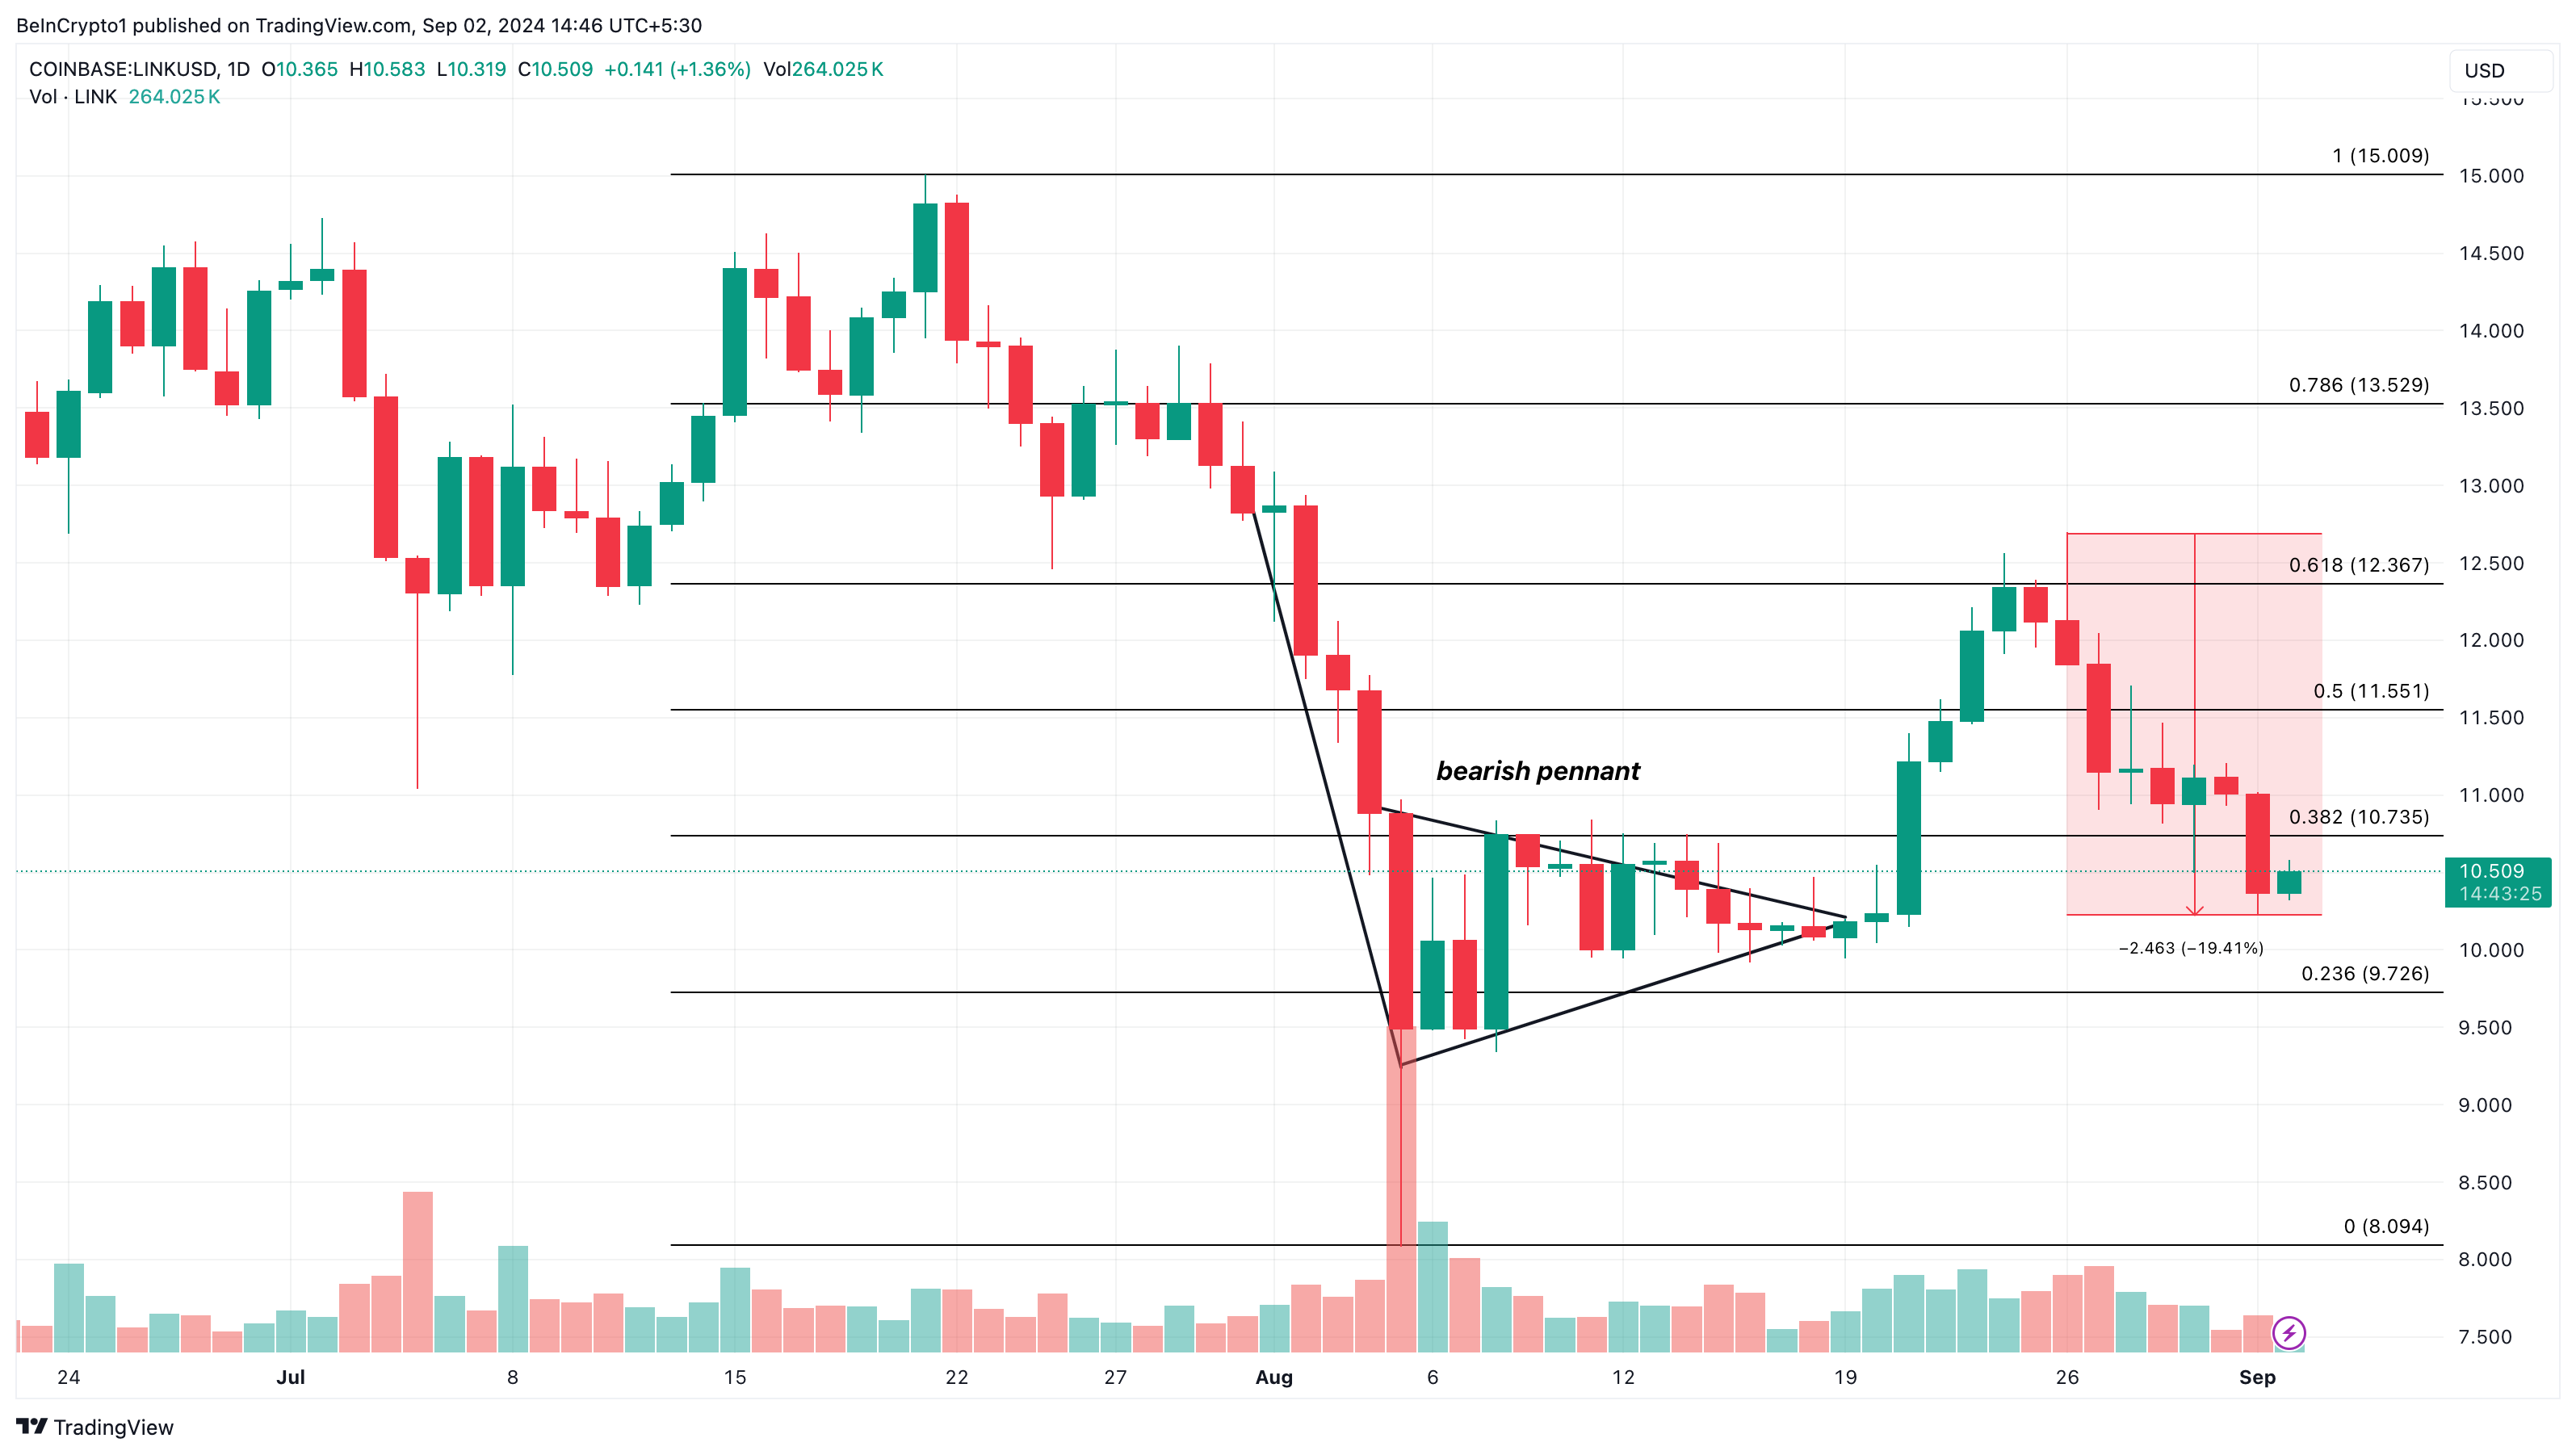 Chainlink Daily Analysis. Source: TradingView
This prediction might be invalidated if the broader altcoin market sees a resurgence. Should that occur, LINK’s price could break through the $10.73 resistance and potentially reach $11.55.
The post 3 Reasons Chainlink (LINK) Price Could Fall to Single Digits appeared first on BeInCrypto.