Why Is The Crypto Market Down Today?
The crypto market shed 1.8% on April 2 as the total market cap dropped to $2.28 trillion after Trump’s prime-time Iran address failed to deliver the de-escalation signal that traders had positioned for. Bitcoin fell almost 2%, closing in on a head-and-shoulders neckline that threatens a 14% breakdown.
Rain (RAIN), ranked inside the top 30, led altcoin losses with a 7% daily drop and 17% decline over the past month.
In the news today:-- President Trump’s Wednesday address said US forces would “finish the job” in Iran within two to three weeks but offered no concrete plan to reopen the Strait of Hormuz. Brent crude surged past $105 as Iran’s parliament continued drafting legislation to make its yuan-based toll system at the strait permanent.
- Solana DEX Drift Protocol was reportedly hacked after Helius CEO Mert Mumtaz flagged a “high likelihood of a potentially large exploit.” The DRIFT token dropped approximately 17% within an hour as the situation developed.
- Riot Platforms, one of the largest US Bitcoin miners, sold 500 BTC worth approximately $34.13 million. Separately, BTC reserve company Empery Digital transferred its remaining 1,795 BTC worth approximately $122.5 million to Gemini. The sell-offs added the sentimental trigger to the crypto market cooldown, as of today.
The total crypto market cap traded at $2.28 trillion on April 2, down 1.8% from the prior close. The decline accelerated after markets processed Trump’s prime-time Iran speech, which framed the conflict as nearing its end but provided no mechanism for reopening the Strait of Hormuz. Oil prices surging past $105 per barrel reinforced the view that energy-driven inflation pressure will persist, keeping risk appetite suppressed across speculative assets.
Want more token insights like this? Sign up for Editor Harsh Notariya’s Daily Crypto Newsletter here.
The entire market was expecting President Trump's address to the nation to be de-escalatory.
Instead, he said the war will continue until late-April, threatened to strike Iranian power plants, and said Iran will be sent back to the "stone age."
Oil prices have all your answers. pic.twitter.com/lx1t5NmHOC
The inability to reclaim the $2.33 trillion resistance level in prior sessions set the stage for this move. Leveraged traders added to the damage. CoinGlass data shows $217 million in long positions were liquidated over the past 24 hours as profit-taking from yesterday’s rally compounded the sell-off. Bitcoin and Ethereum accounted for nearly $192 million of total liquidations combined.
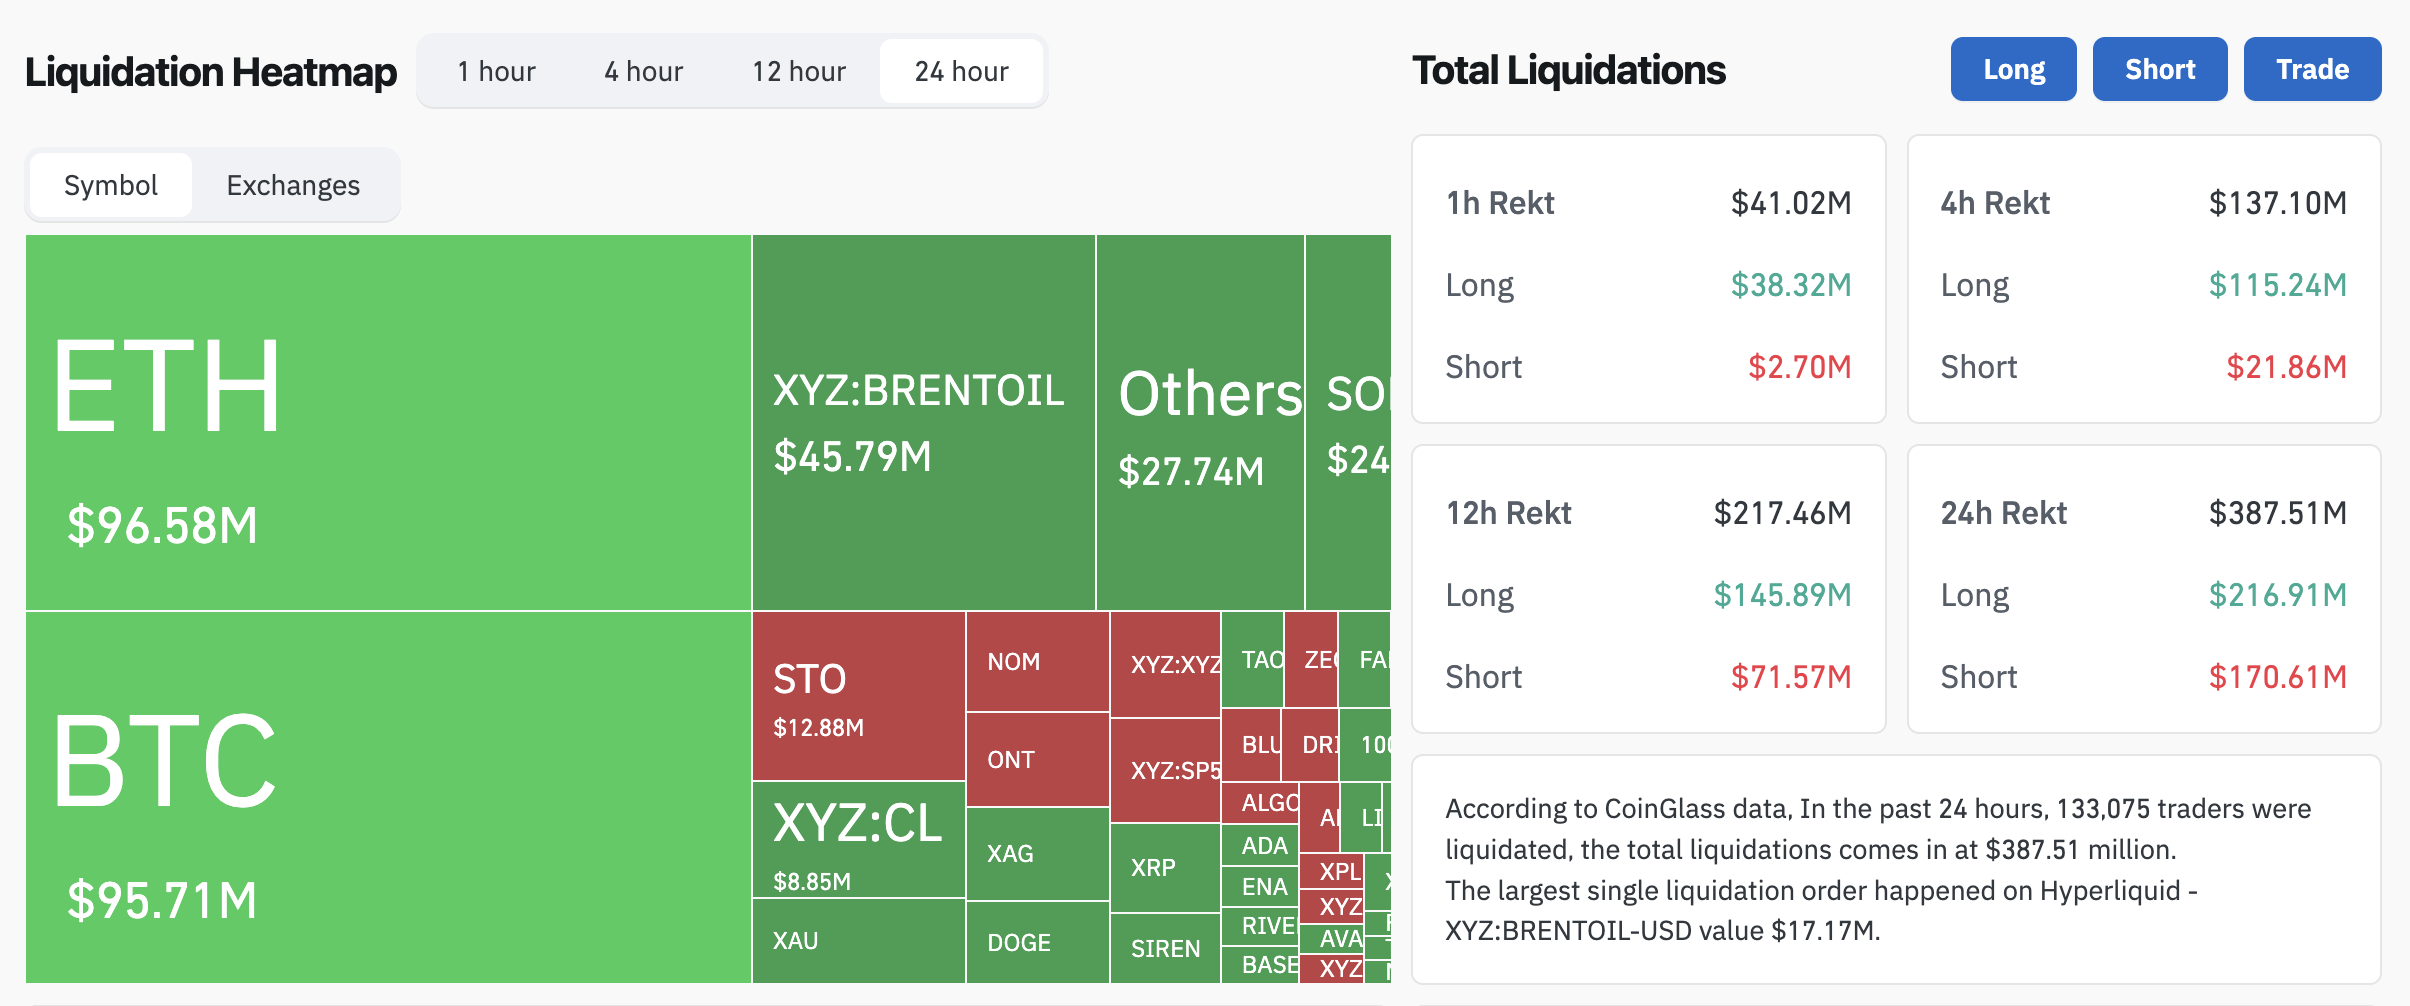 24-Hour Liquidation Map: Coinglass
The $2.23 trillion support level now stands as the line between a contained pullback and a deeper correction. A daily close above $2.33 trillion would keep the market within its recent range. To turn bullish in the short-term, the TOTAL ticker must have a daily close above $2.49 trillion.
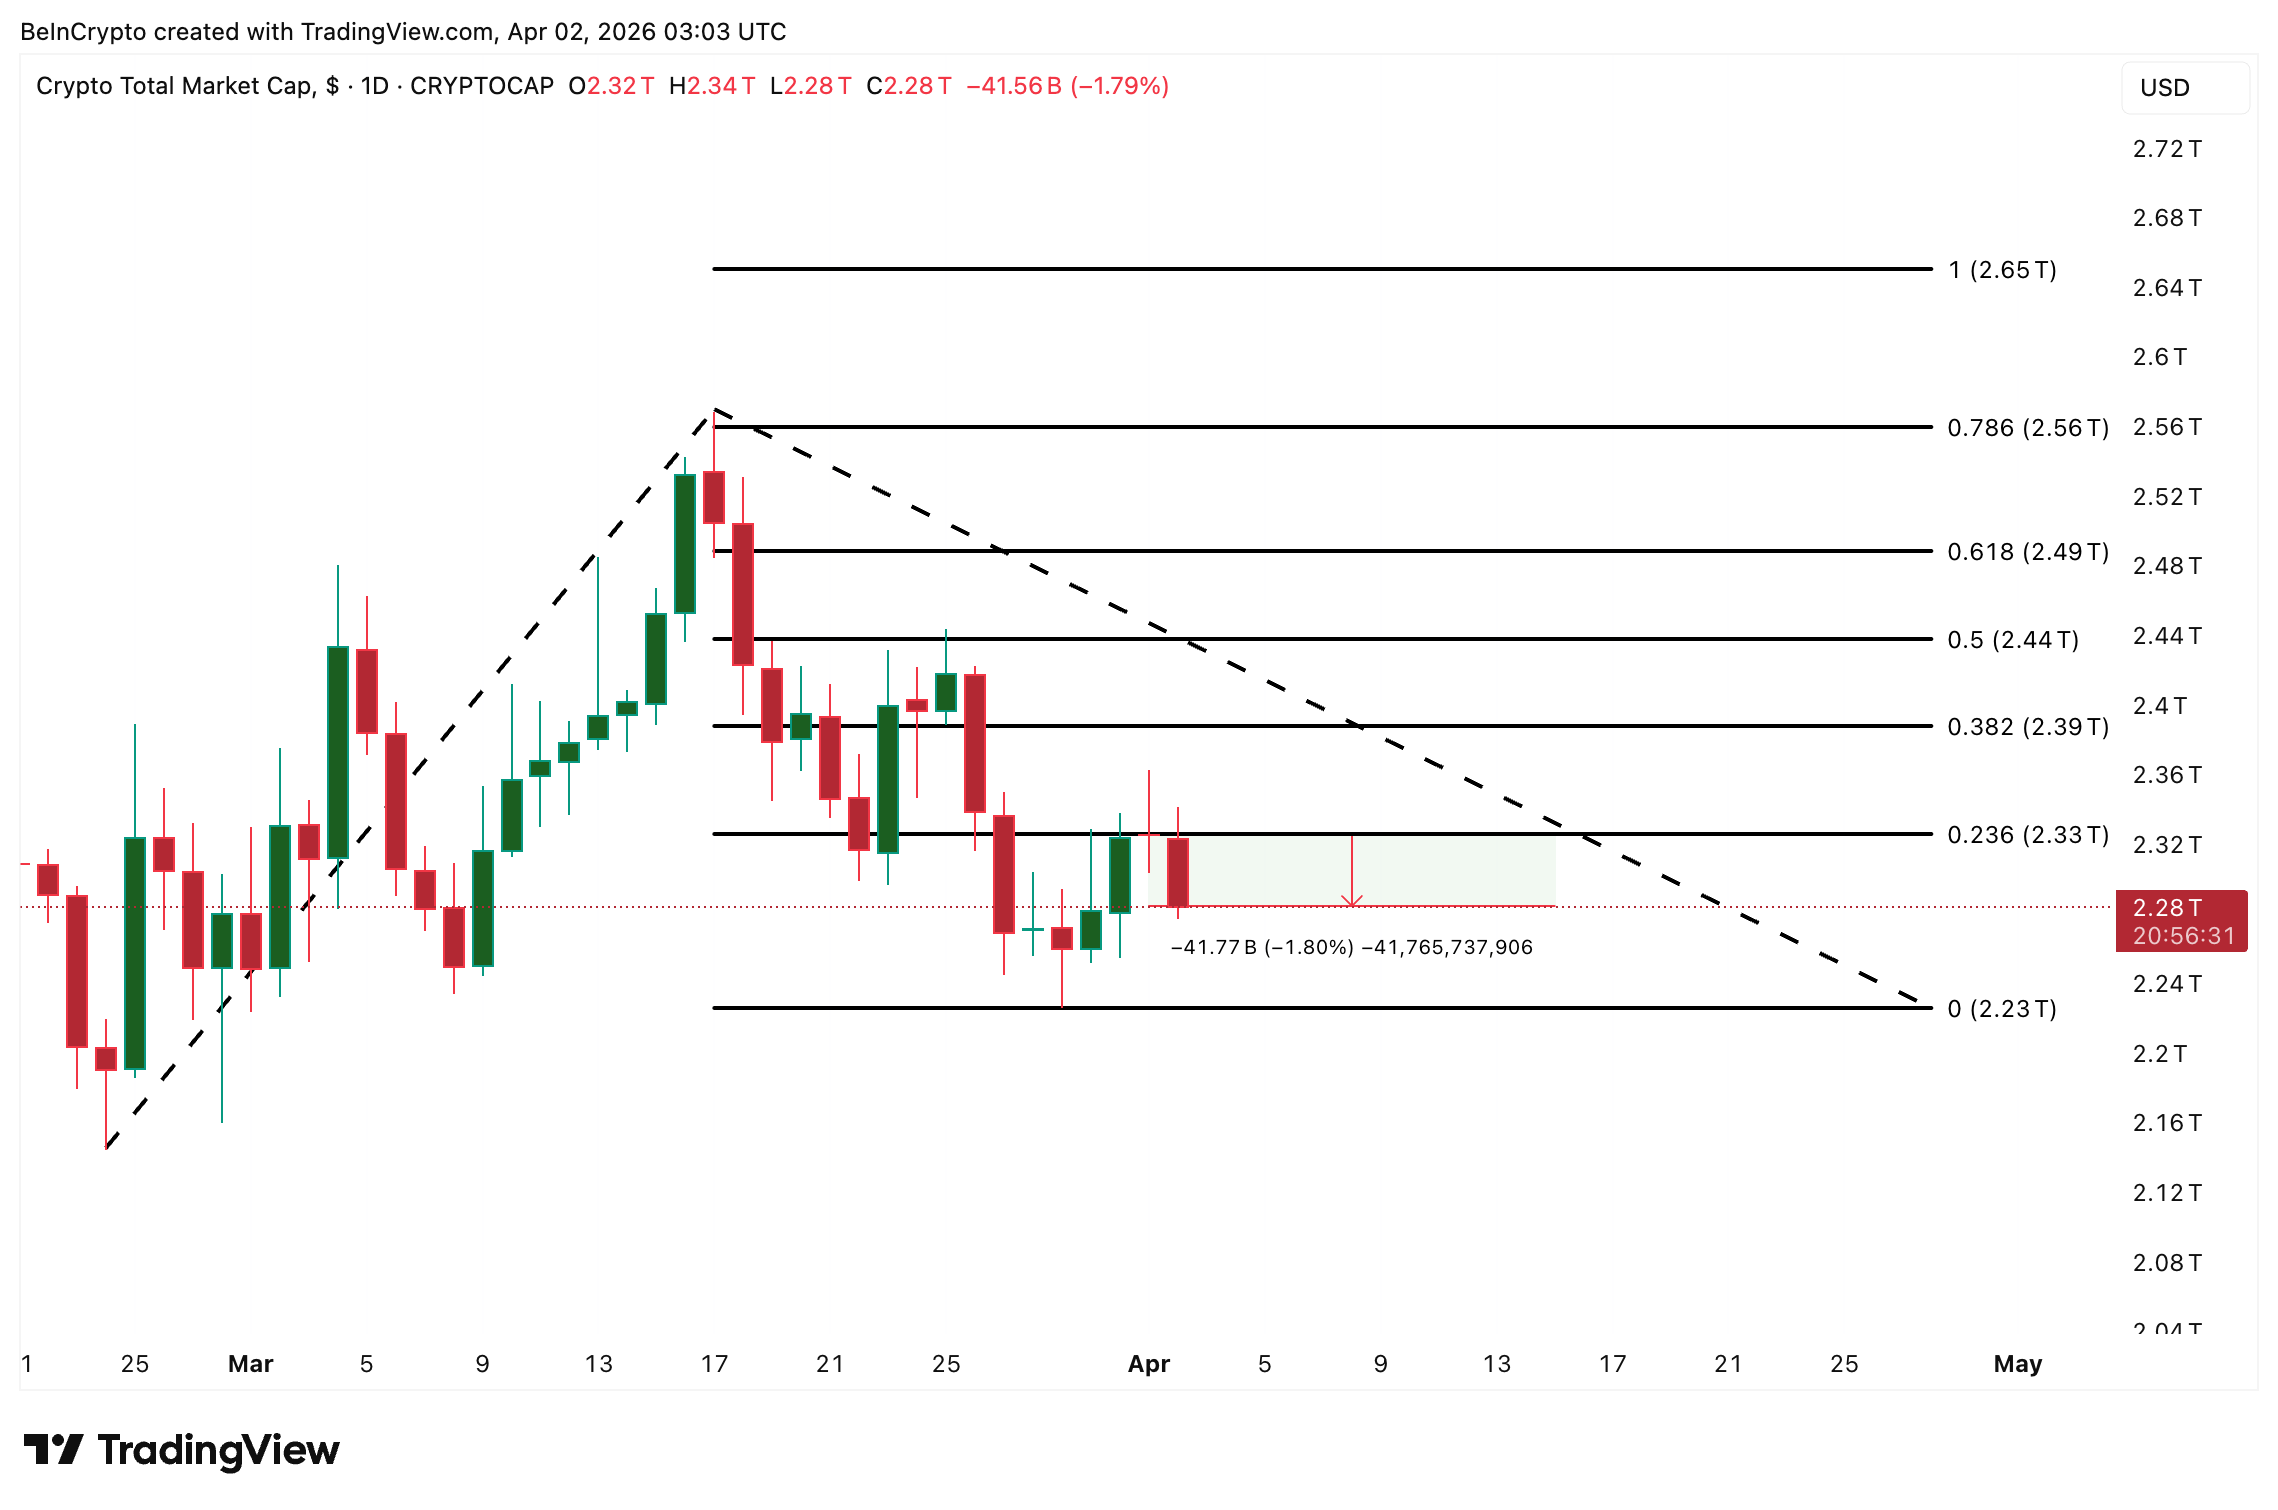 TOTAL Crypto Market Cap Analysis: TradingView
Losing the $2.23 trillion support exposes lower levels.
Bitcoin’s Head-and-Shoulders Neckline Tightens the PressureBitcoin traded at $66,935, down almost 2% and underperforming the broader market by a small margin. The daily chart shows a head-and-shoulders pattern that has been forming since early March.
The Hormuz-driven risk-off environment is accelerating this drift. Bitcoin miner selling added a supply-side headwind. Riot Platforms offloaded 500 BTC while Empery Digital moved 1,795 BTC to Gemini in what appears to be pre-sale positioning. These flows, combined with the failed de-escalation narrative, are pushing Bitcoin closer to the neckline faster than the pattern alone would suggest.
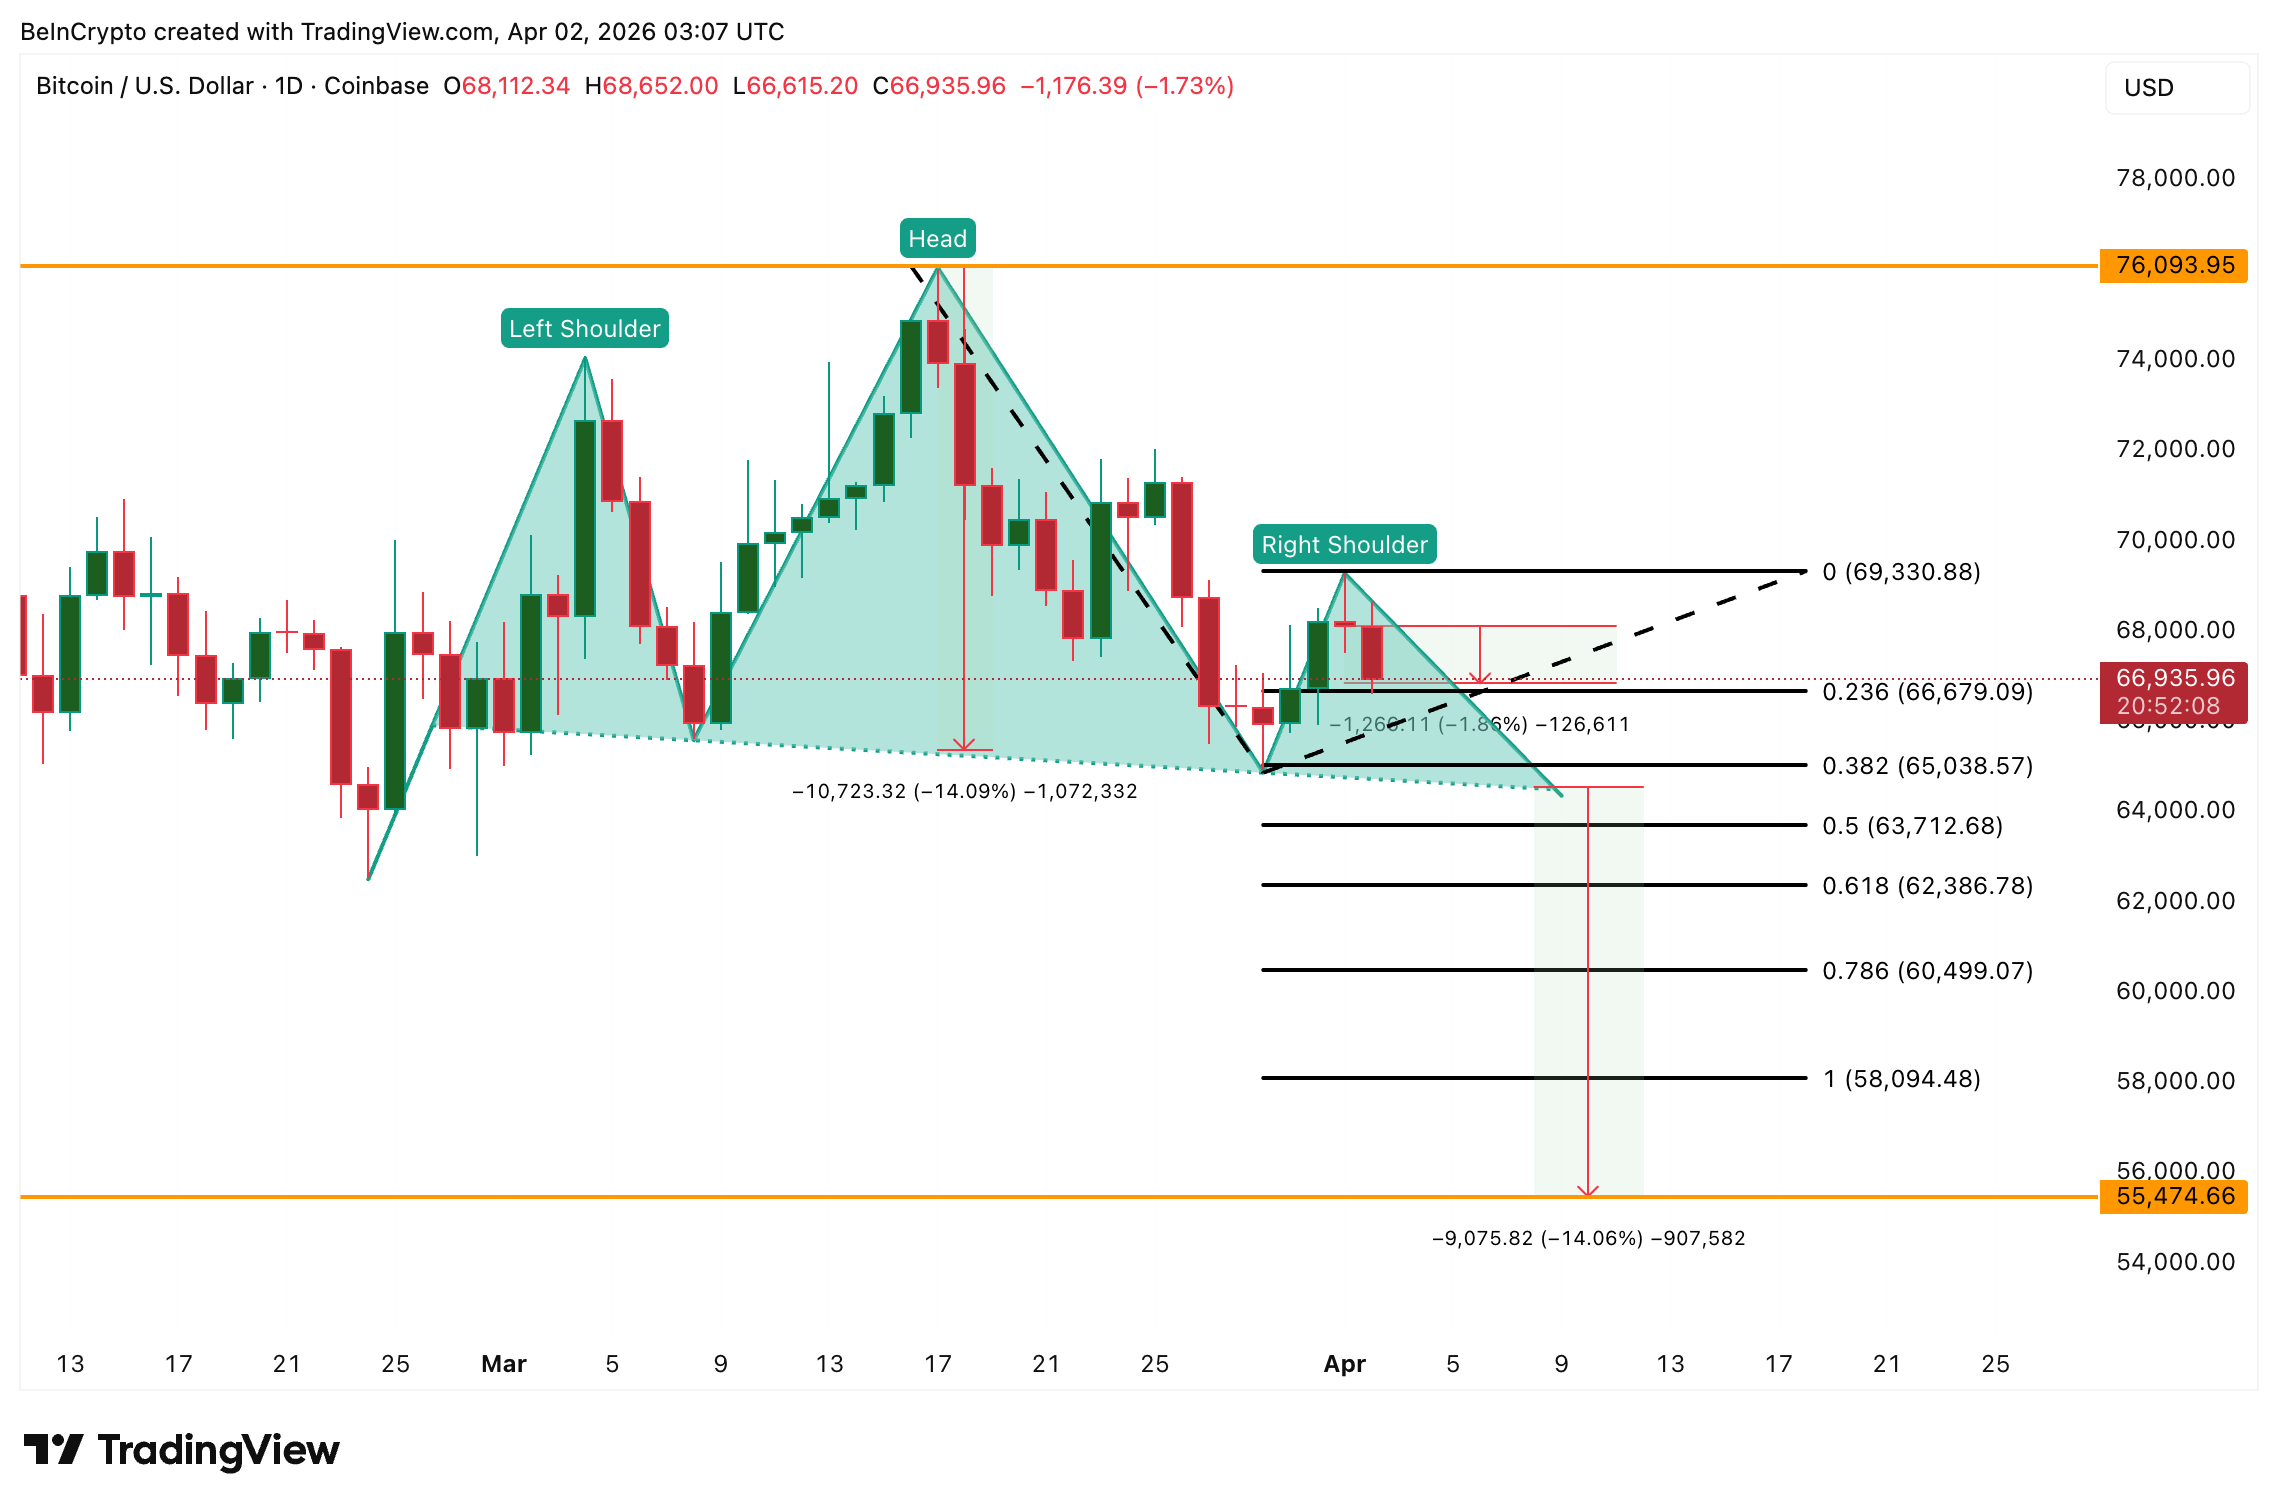 Bitcoin Price Analysis: TradingView
A break under $65,038 possibly activates the measured move of approximately 14%, targeting $55,474. The 0.618 level at $62,386 offers intermediate support on the way down. To reverse the pressure, Bitcoin needs a daily close above $69,330. Only a reclaim of $76,090 would invalidate the bearish structure entirely.
A daily close below $65,038 targets $55,474 and could likely drag the total crypto market cap closer to the $2.23 trillion level with it.
Rain (RAIN) Leads Altcoin Losses Inside a Falling ChannelRain traded at $0.00756, down 7% on the day and 17% over the past 30 days. The top-30 token (checked at press time) has been one of the hardest-hit names during this correction cycle, amplifying the broader market weakness that Bitcoin’s head-and-shoulders drift is creating.
The 8-hour chart shows a falling channel that has contained RAIN’s price action since mid-March. The token broke below all key Exponential Moving Averages (EMAs), trend indicators that weight recent price action more heavily, on March 30. The 20-period EMA sits at $0.00808 and the 50-period at $0.00840, both well above the current price.
The last time RAIN lost the 20-period EMA, the price corrected by approximately 20%. A similar drop from the current level would push it toward the lower trendline of the falling channel near $0.00675. The 0.618 technical level at $0.00741 stands as the nearest support between here and that trendline.
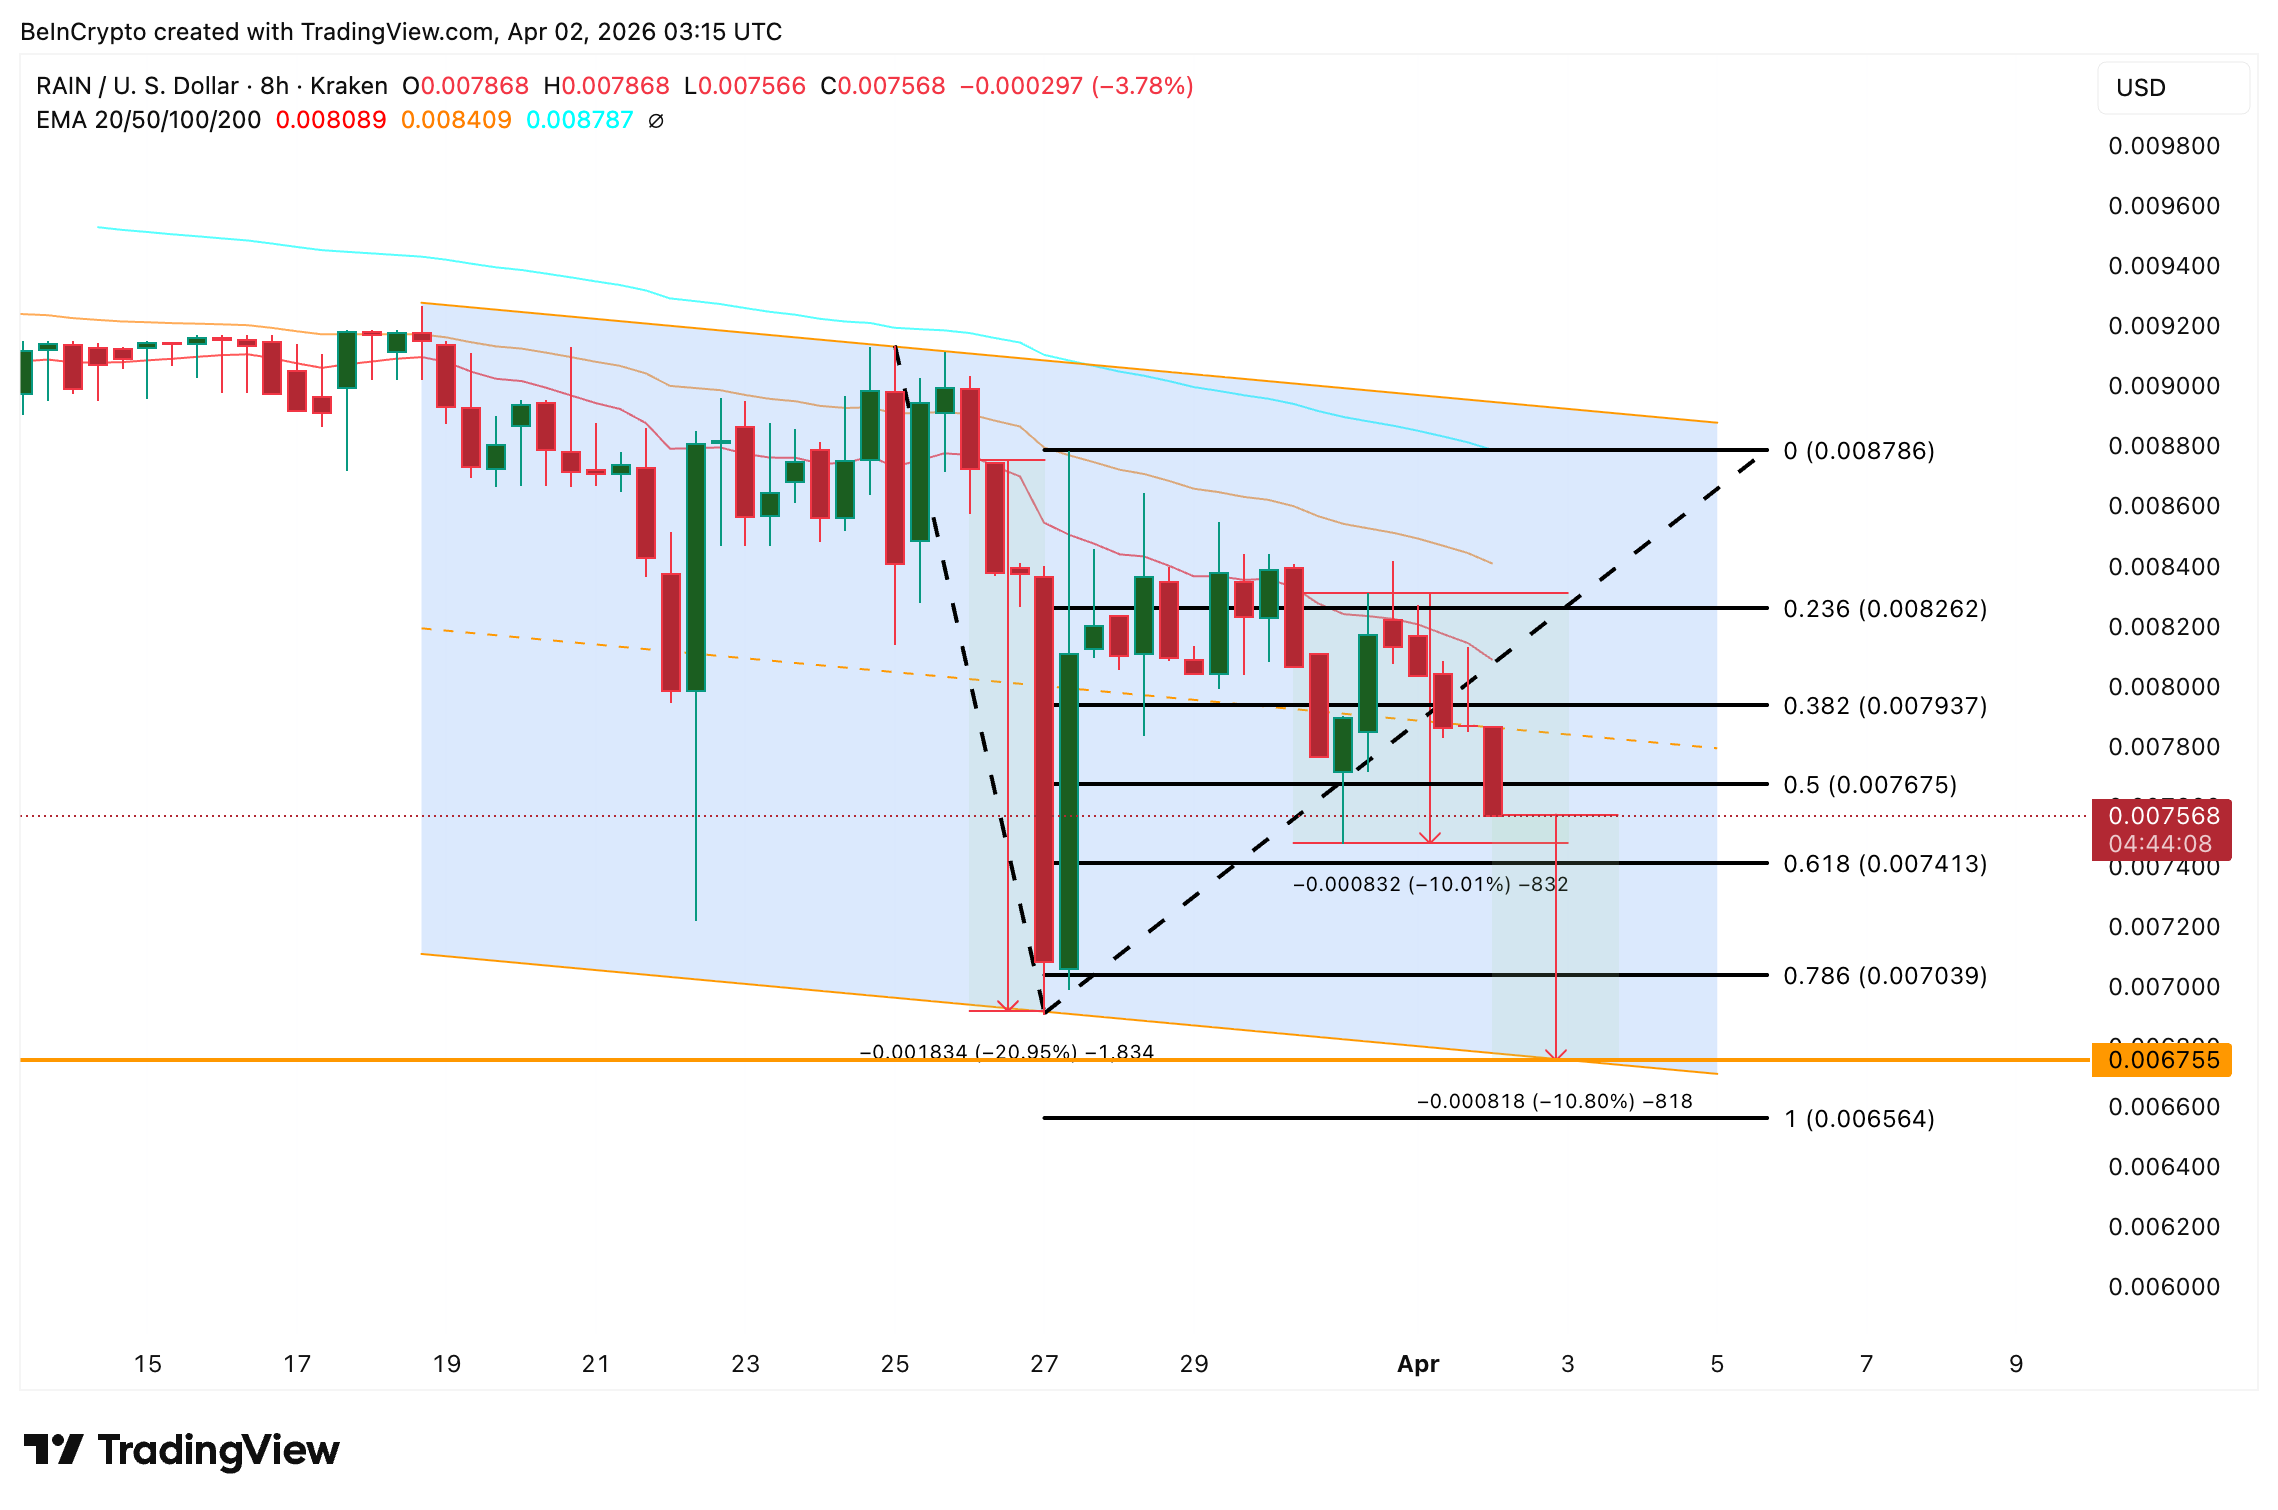 RAIN Price Analysis: TradingView
To regain strength, RAIN first needs to reclaim $0.00808 and then $0.00840 to move back above the EMA cluster. A push above $0.00878 would also mean reclaiming the 100-period EMA and possibly exiting the bearish structure. Right now, $0.00741 separates a contained mid-channel pullback from a full slide toward the lower trendline at $0.00675.
The post Why Is The Crypto Market Down Today? appeared first on BeInCrypto.