PI Price Analysis: PI Holds $0.20 Support After Triangle Breakdown—What’s Next?

The post PI Price Analysis: PI Holds $0.20 Support After Triangle Breakdown—What’s Next? appeared first on Coinpedia Fintech News
The PI price is trading near $0.206, trying to stabilize after a sharp move that followed a clear technical breakdown. On the 4-hour chart, the Pi Network price had been consolidating inside a symmetrical triangle, formed by lower highs and higher lows. This pattern typically signals compression before a larger move. In PI’s case, the structure broke to the downside near the apex, pushing price toward the $0.20–$0.202 area before buyers stepped in with a rebound.
While the bounce looks constructive, PI price action still reads like a post-breakdown retest rather than a confirmed trend reversal. In many setups, the broken trendline acts as overhead resistance. That makes the next few candles critical: PI must reclaim key levels with stronger volume to shift momentum back in favor of bulls.
PI Price Support Levels to WatchThe most important support zone sits at $0.20–$0.19. Bulls need to defend this range to prevent a deeper sell-off. If PI loses $0.19, downside risk increases quickly, with the next likely demand pocket near $0.185–$0.18. As long as the price holds above $0.20, the market can continue to base and attempt a recovery.
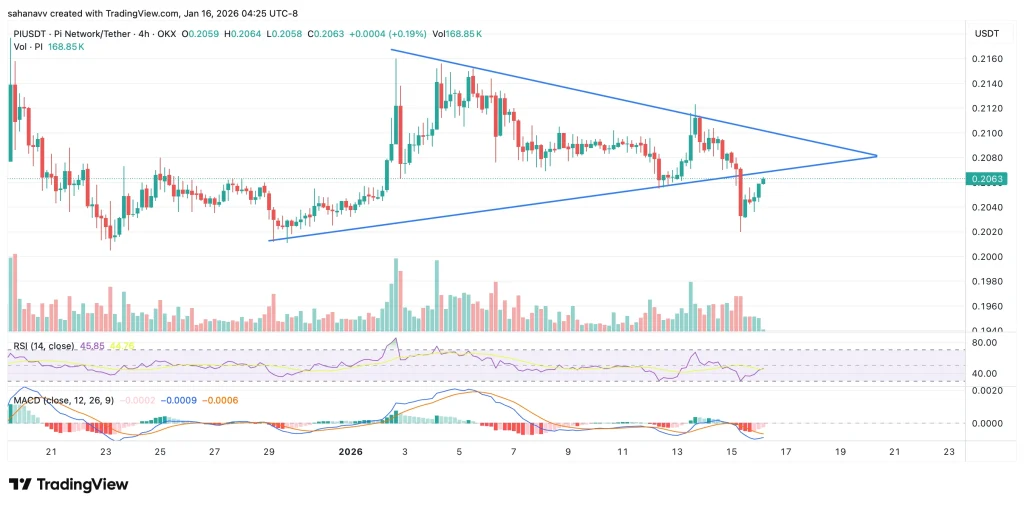
PI Resistance Levels and Upside Targets– On the upside, the first major hurdle is $0.208–$0.212. A sustained move above this band—ideally with rising volume—would reduce breakdown risk and improve the short-term outlook. If PI reclaims $0.212, the next upside area to watch is $0.214–$0.216, where prior selling pressure showed up during the earlier consolidation.
.article-inside-link { margin-left: 0 !important; border: 1px solid #0052CC4D; border-left: 0; border-right: 0; padding: 10px 0; text-align: left; } .entry ul.article-inside-link li { font-size: 14px; line-height: 21px; font-weight: 600; list-style-type: none; margin-bottom: 0; display: inline-block; } .entry ul.article-inside-link li:last-child { display: none; }- Also Read :
- Bitcoin, Ethereum Price Action: Crypto Market Recap and Biggest Moves in the Last 24 Hours
- ,
RSI and MACD Signal a Fragile Recovery—Momentum remains mixed. RSI is in the mid-40s, which suggests limited bullish strength. MACD is still subdued, indicating the rebound may struggle unless PI breaks resistance cleanly.
The Bottom LinePI price is now at a make-or-break zone, and the next move likely depends on whether buyers can turn this rebound into a reclaim. If PI/USDT holds above $0.20–$0.19 and pushes through $0.208–$0.212, the breakout can shift momentum back to the upside, with $0.214–$0.216 as the next immediate target. However, if the price gets rejected near resistance and slips back below $0.20, the risk of another sell-off increases. A decisive break under $0.19 could open the door toward $0.185–$0.18, where the next demand pocket sits
FAQs What is the Pi price prediction for 2026?Pi price prediction for 2026 suggests a range between $0.85 and $3.50, depending on adoption progress and market momentum.
What is the Pi Network price prediction for 2030?Pi Network price prediction for 2030 targets a potential high near $22.00 if ecosystem growth and real-world utility improve.
Is Pi Coin a good long-term investment?Pi carries high risk due to limited utility and listings, but long-term upside depends on successful integration and network adoption.