GOAT Price Shows Weakening Momentum After Reaching Top 10 Meme Coins Ranking
GOAT price has skyrocketed 214.29% in one month, recently breaking into the $1 billion market cap and securing its place as the 10th largest meme coin. It now stands just ahead of MOG, which closely trails its position in the rankings.
However, recent indicators suggest that GOAT’s uptrend may be weakening, raising questions about whether it can sustain its rally or face a potential correction.
GOAT BBTrend Is Negative For The First Time In 4 DaysGOAT BBTrend has turned negative for the first time since November 17, now sitting at -0.54. This shift suggests that bearish momentum is beginning to take hold, with the asset’s recent upward trajectory starting to weaken potentially.
BBTrend measures the strength and direction of price trends using Bollinger Bands, with positive values indicating an uptrend and negative values signaling a downtrend. A negative BBTrend reflects increased downward pressure, which could indicate the start of a broader market shift.
 GOAT BBTrend. Source: TradingView
GOAT has had an impressive November, gaining 61% and reaching a new all-time high on November 17.
However, the current negative BBTrend, if it persists and grows, could signal the potential for further bearish momentum.
GOAT Is In A Neutral ZoneGOAT’s RSI has dropped to 52, down from over 70 a few days ago when it reached its all-time high. This decline indicates that buying momentum has cooled off, and the market has moved out of the overbought zone.
The drop suggests a shift toward a more neutral sentiment as traders consolidate gains and the strong bullish pressure seen earlier subsides.
 GOAT RSI. Source: TradingView
RSI measures the strength and velocity of price changes, with values above 70 indicating overbought conditions and below 30 signaling oversold levels. At 52, GOAT’s RSI is in a neutral zone, neither signaling strong bullish nor bearish momentum.
This could mean the current uptrend is losing strength, and the price may consolidate or move sideways unless renewed buying pressure reignites upward momentum.
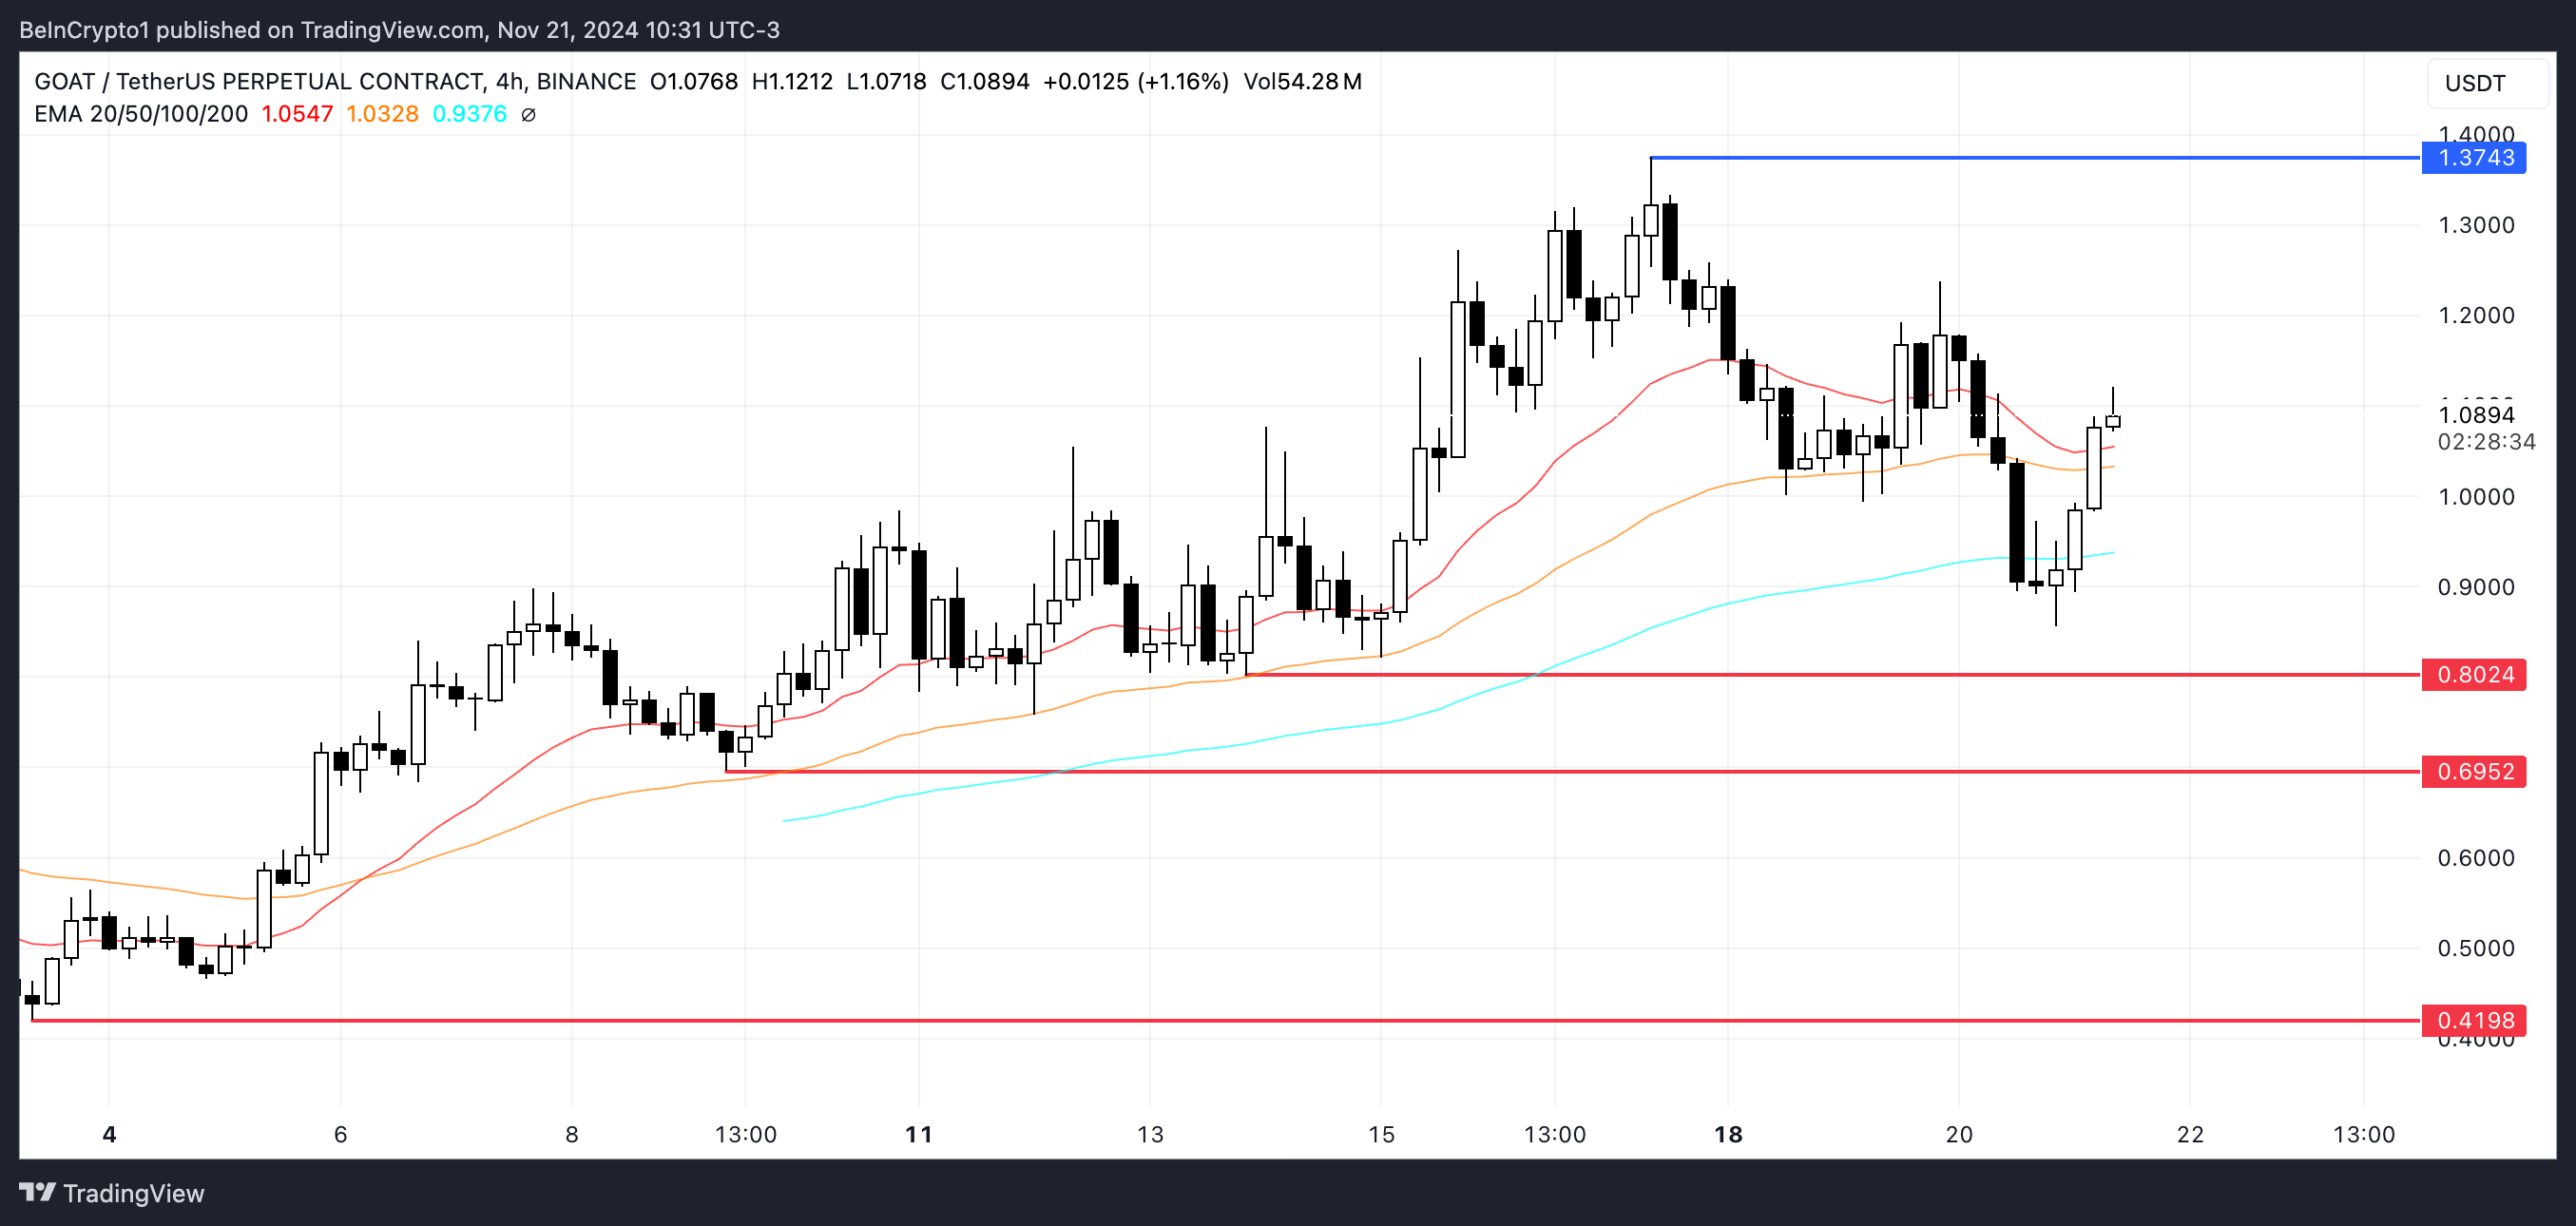
GOAT Price Prediction: A New Surge Until $1.50?If GOAT current uptrend regains strength, it could retest its all-time high of $1.37, establishing its market cap above $1 billion, a fundamental threshold for being among the biggest meme coins in the market today.
Breaking above this level could pave the way for further gains, potentially reaching the next thresholds at $1.40 or even $1.50, signaling renewed bullish momentum and market confidence.
 GOAT Price Analysis. Source: TradingView
However, as shown by indicators like RSI and BBTrend, the uptrend may be losing steam. If a downtrend emerges, GOAT price could test its nearest support zones at $0.80 and $0.69.
Should these levels fail to hold, the price could fall further, potentially reaching $0.419, putting its position in the top 10 ranking of biggest meme coins at risk.
The post GOAT Price Shows Weakening Momentum After Reaching Top 10 Meme Coins Ranking appeared first on BeInCrypto.
