Ethereum Price Squeezed at $3,100: Is ETH Coiling for a Violent Breakout?

The post Ethereum Price Squeezed at $3,100: Is ETH Coiling for a Violent Breakout? appeared first on Coinpedia Fintech News
Ethereum price showed a daily uptick of over 2%, reclaimed the $3100 zone during the intraday session, but the volatility remains unusually compressed. For the past few sessions, ETH has traded sideways, absorbing supply while refusing to lose its $3000 support level.
The current price action points to a coiling phase rather than exhaustion. The short-term range of $2900-$3400 is a critical area of focus for sharp directional moves ahead.
Ethereum Price Chart Forms Inverted Head and Shoulders Pattern: What Does It MeanOn the daily chart, Ethereum (ETH) remained sideways around $3000, while facing immediate resistance around $3200. However, the chart structure leans bullish, suggesting a massive upside toward $4800 in the coming sessions.
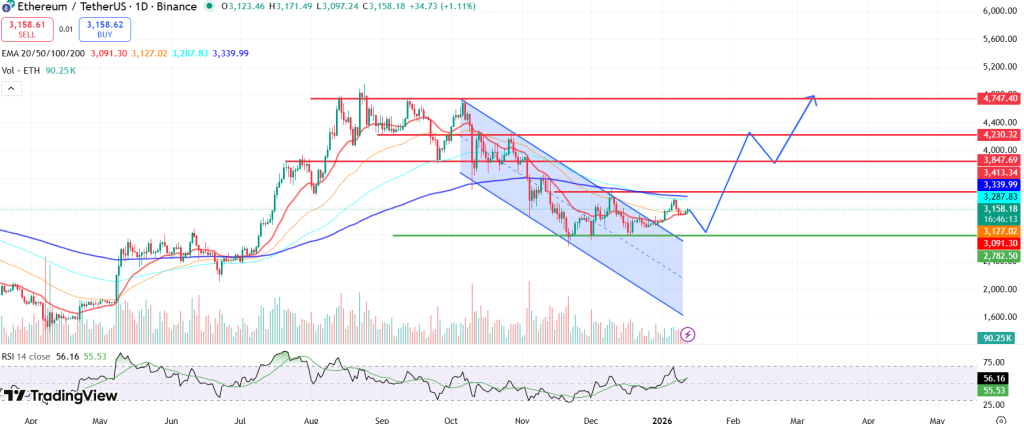
Looking at the key indicators, the RSI line is holding above the neutral 50 level, while the MACD indicator is flat near equilibrium, reflecting a balance rather than weakness.
The weekly chart adds more weight on the bullish thesis. According to the analyst’s post, he cited that ETH appears to be forming an inverse head-and-shoulders pattern, with price consolidating near the upper volume shelf.
